Hello,
Could you describe what you mean by number of flashes? Thank you.
Regards
Search found 129 matches
- Fri Mar 29, 2024 4:05 pm America/New_York
- Forum: Questions/Comments
- Question: FLASHES FOR SPECIFIC DATA AND PLACE
- Replies: 1
- Fri Mar 29, 2024 4:03 pm America/New_York
- Forum: Questions/Comments
- Question: Problems related to cloud properties of CERES clouds in spherical radiation budget systems
- Replies: 2
Re: Problems related to cloud properties of CERES clouds in spherical radiation budget systems
Hello,
Thank you for your interest in CERES data.
We have notified a member of the CERES Science team and they will answer your question shortly.
Thank you.
Regards.
Thank you for your interest in CERES data.
We have notified a member of the CERES Science team and they will answer your question shortly.
Thank you.
Regards.
- Thu Feb 08, 2024 11:02 am America/New_York
- Forum: Questions/Comments
- Question: Plotting Total Backscatter Coefficient 532
- Replies: 3
Re: Plotting Total Backscatter Coefficient 532
Hello, That user specifically wanted to subset the data at a specific range of latitudes. Here is what the plot looks like when graphed at all latitudes: Here is what the plot looks like when opened in Panoply (note: it is flipped). Panoply is a Panoply plots geo-referenced and other arrays from net...
- Wed Feb 07, 2024 8:18 am America/New_York
- Forum: Questions/Comments
- Question: Plotting Total Backscatter Coefficient 532
- Replies: 3
Re: Plotting Total Backscatter Coefficient 532
Hello,
Thank you for your interest in CALIPSO data.
It appears that there is nothing wrong with your plot. You can verify this if you open the file in Panoply. Looking at the data there is a lot of fill values especially in the lower altitudes like you mentioned (0 - 15 km).
Regards,
ASDC
Thank you for your interest in CALIPSO data.
It appears that there is nothing wrong with your plot. You can verify this if you open the file in Panoply. Looking at the data there is a lot of fill values especially in the lower altitudes like you mentioned (0 - 15 km).
Regards,
ASDC
- Wed Jan 17, 2024 2:32 pm America/New_York
- Forum: Questions/Comments
- Question: Determination of cloud position in CERES products
- Replies: 4
Re: Determination of cloud position in CERES products
Hello, We contacted a member of the CERES Science team and they have stated: CERES and the imager measurements are satellite based and they are measuring the radiation emitted near the top of the cloud. Therefore, the window channel imager radiance after having atmospheric corrections applied is use...
- Tue Jan 16, 2024 2:36 pm America/New_York
- Forum: Questions/Comments
- Question: Determination of cloud position in CERES products
- Replies: 4
Re: Determination of cloud position in CERES products
Hello, Thank you for your interest in CERES data. The cloud effective temperature of the cloud is the temperature returned from the Planck function using the observed imager radiance. The cloud effective height is the corresponding height you would find that temperature in the temperature profile. T...
- Fri Jan 12, 2024 9:42 am America/New_York
- Forum: Questions/Comments
- Question: Screening the CALIPSO aerosol profiles based on CAD score
- Replies: 2
Re: Screening the CALIPSO aerosol profiles based on CAD score
Hello, We used code made by HDF-EOS that graphs the Extinction Coefficient v Altitude and revised it to only plot values based on the CAD Score greater than -20. import os import numpy as np import matplotlib as mpl import matplotlib.pyplot as plt from pyhdf import HDF, SD, VS from pyhdf.SD import S...
- Fri Jan 12, 2024 7:36 am America/New_York
- Forum: Questions/Comments
- Question: Screening the CALIPSO aerosol profiles based on CAD score
- Replies: 2
Re: Screening the CALIPSO aerosol profiles based on CAD score
Hello,
Thank you for your interest in CALIPSO data.
We're currently working on python code to get you what you need. Thank you for your patience.
Regards,
ASDC
Thank you for your interest in CALIPSO data.
We're currently working on python code to get you what you need. Thank you for your patience.
Regards,
ASDC
- Mon Dec 18, 2023 10:15 am America/New_York
- Forum: Questions/Comments
- Question: Create a time series of Monthly Zonal Mean with SAGE III-ISS images
- Replies: 0
Create a time series of Monthly Zonal Mean with SAGE III-ISS images
The ASDC now has code in the ASDC_Data_and_User_Services Github that uses SAGE III-ISS' Browse Imagery Service, Quicklook where users can retrieve and create a time series of Monthly Zonal Mean images.
Example:
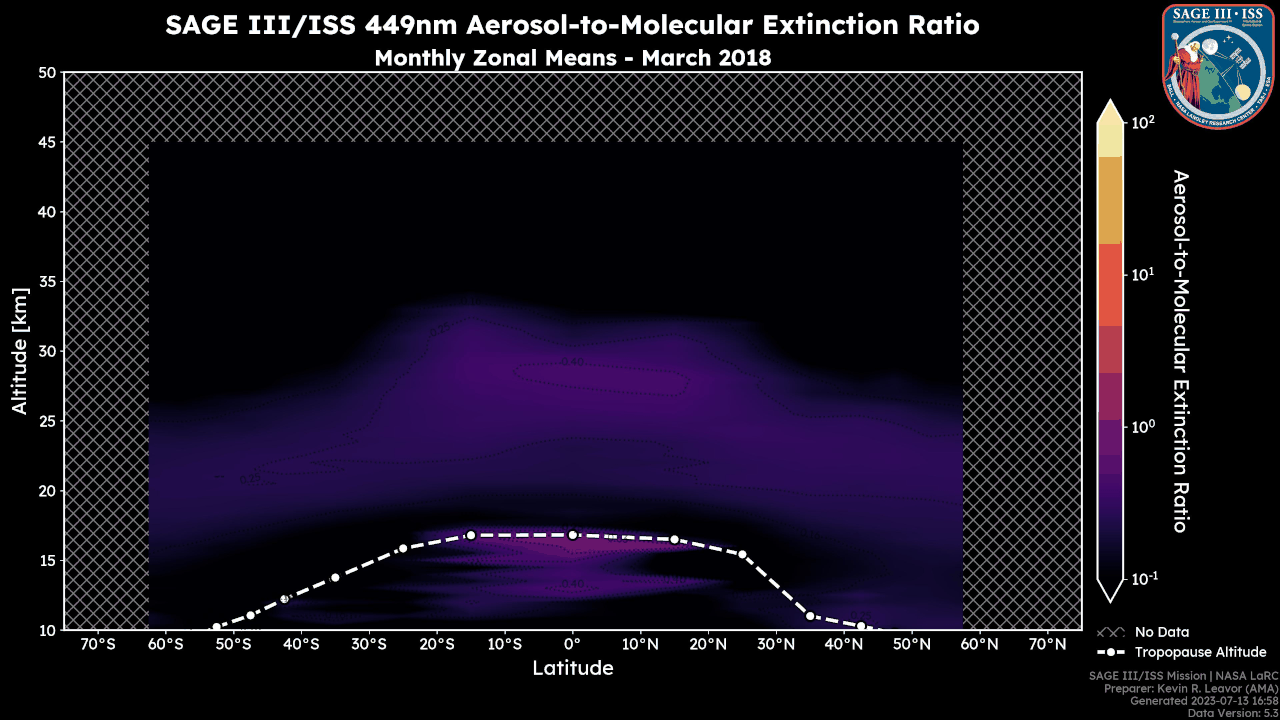
Example:
- Wed Dec 13, 2023 10:36 am America/New_York
- Forum: Questions/Comments
- Question: Inquiry Regarding CERES_SSF_NOAA-20_Edition1B IWP Data
- Replies: 4
Re: Inquiry Regarding CERES_SSF_NOAA-20_Edition1B IWP Data
Hello, A member of the CERES Science team has suggested that to get a total IWP, you should weight each layer’s IWP by the corresponding layer 1 or layer 2 fraction before adding and then dividing by the sum of the two layer fractions. You could use either percentage or fraction as long as you don’t...