MODIS aqua level 3 chl-a data processing
MODIS aqua level 3 chl-a data processing
Hello Everyone,I am new here and also new in this field. I want to find the “Seasonal variability chl-a concentration of Bay of Bengal”. I have already downloaded “MODIS aqua level-3 SMI 4 km monthly average “data.My question is how I can process and analyze the image (nc file). At first, I was curious about SeaDAS, but due to using windows, I can’t install “oc processor”. I also have no idea about programming language or using terminal in linux. So now, how can analyze those MODIS images? Still can I use seaDAS in linux ? or Can I process image in ArcGIS or something other softwares ?I am hopeful to get a good, precise and elaborate solution from you all experts.Thanks,Antu
Tags:
-
OB.DAAC - amscott
- User Services

- Posts: 352
- Joined: Mon Jun 22, 2020 5:24 pm America/New_York
- Has thanked: 8 times
- Been thanked: 3 times
MODIS aqua level 3 chl-a data processing
Hello Antu,
Here are two pages that will help you install SeaDAS in Linux as well as get you started using the software:
https://seadas.gsfc.nasa.gov/tutorials/installation_tutorial/
https://seadas.gsfc.nasa.gov/tutorials/video_tutorials/
Here are two pages that will help you install SeaDAS in Linux as well as get you started using the software:
https://seadas.gsfc.nasa.gov/tutorials/installation_tutorial/
https://seadas.gsfc.nasa.gov/tutorials/video_tutorials/
-
OB.DAAC - SeanBailey
- User Services
- Posts: 1469
- Joined: Wed Sep 18, 2019 6:15 pm America/New_York
- Been thanked: 5 times
MODIS aqua level 3 chl-a data processing
Antu,
SeaDAS is designed to visualize, analyze AND process the satellite data we distribute. Since you've downloaded L3 mapped data, you've got the highest level processing that is available and do not need the processing code. In fact, unless you wish to have products we do not distribute (our code can generate many more products than we distribute), you do not need the processing code.
Give SeaDAS a try :grin:
Regards,
Sean
MODIS aqua level 3 chl-a data processing
As others mentioned, the lack of the OCSSW Processing System on Windows should not be a problem if you are using level-3 mapped files. The SeaDAS GUI does include the BEAM Graph Processing Facility, which can be used in the GUI but also in command-line (terminal) mode via the Graph Processing Tool (GPT) on Windows. For studies of seasonal variability you may want to extract a time-series of statistics for a various regions bounded by polygons, something for which GPF can be useful.
Thanks to the NetCDF4-CF standard, level-3 mapped files are well supported by recent versions wide range of scientific and GIS software, include both free and commercial GIS systems. For older versions you may need to export the NetCDF4-CF files to geotiffs. The preserves the geolocation metadata, but discards other metadata such as units and processing details.
For a quick way to get started looking at the data, you might try Giovanni (listed under Services/Software and Tools on the OceanColor Forum page, but the link is broken). Giovanni has a (temporarily broken) time-series areal statistics capability.
The NASA SeaDAS is based on ESA BEAM. You find the ESA BEAM tutorials and documentation useful for the SeaDAS GUI. ESA has stopped development of BEAM in favor of a new tool, SNAP. SNAP supports many ESA missions and sensors, so can be a bit overwhelming at first, but some users find the GUI more responsive and less prone to freezing than BEAM or SeaDAS (probably depending on graphics hardware and drivers).
MODIS aqua level 3 chl-a data processing
Hello amscott,
Thanks for your response. In linux, there is problem in installing seadas. virtual machine and osgeo-live-10.5-vm is used here. Should i choose manual installation ?
Thanks for your response. In linux, there is problem in installing seadas. virtual machine and osgeo-live-10.5-vm is used here. Should i choose manual installation ?
MODIS aqua level 3 chl-a data processing
Hello Sean,
thanks for your response , your reply really help me a lot. I forget that level-3 was already processed data. By the way, i have analyzed the data and make a output like that picture.. But now I need to add the country border line of Bangladesh behind the coastline. do you have any idea how i can do this ?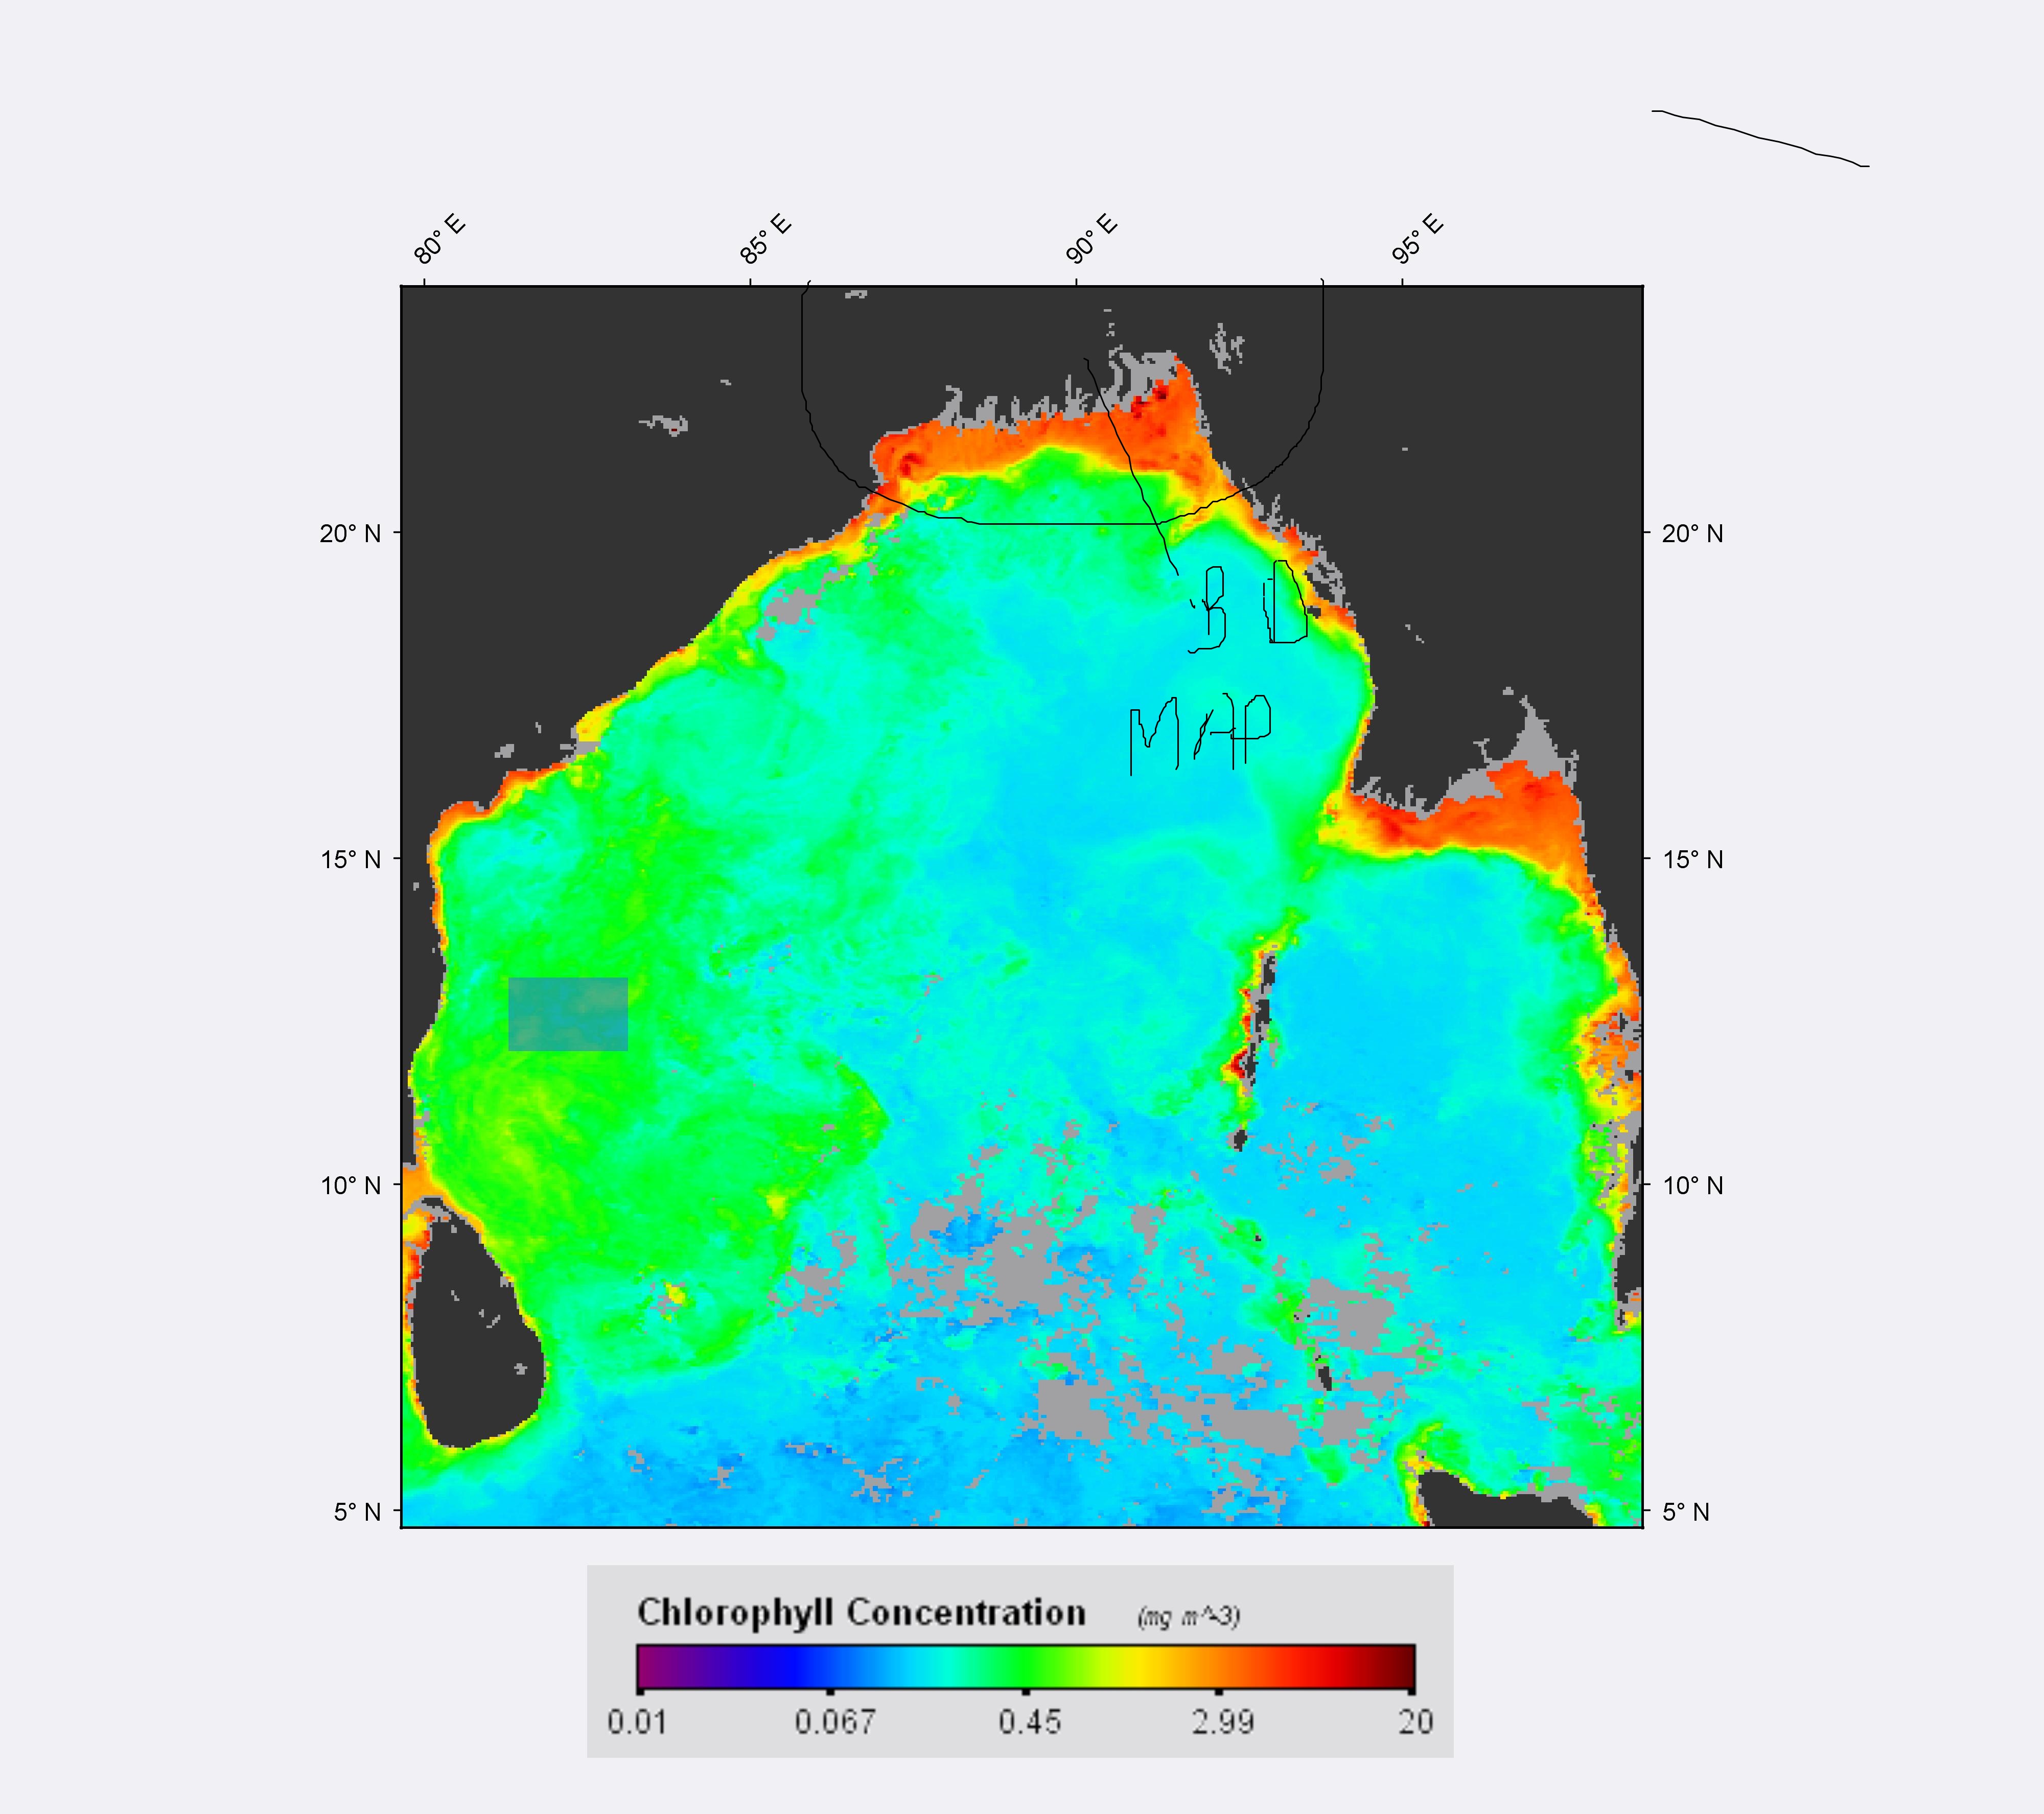
thanks for your response , your reply really help me a lot. I forget that level-3 was already processed data. By the way, i have analyzed the data and make a output like that picture.. But now I need to add the country border line of Bangladesh behind the coastline. do you have any idea how i can do this ?
MODIS aqua level 3 chl-a data processing
Hello gnwiii,
Thank for you suggestion. Your full and elaborate suggestion quiet appreciable to me. According to your suggestion, I noticed that the features of SNAP and seaDAS are same to me ( after watching tutorial of SNAP). What types of facilities I can get more in SNAP ?
You also said about Giovanni. why should I use Giovanni over Ocean Color?
-
OB SeaDAS - knowles
- Subject Matter Expert

- Posts: 271
- Joined: Mon Apr 07, 2008 4:40 pm America/New_York
MODIS aqua level 3 chl-a data processing
How to add country border lines to an image in SeaDAS:
SeaDAS can import any shapefile and display it as a layer over an image.
SeaDAS does not provide a country border shapefile, but they can be found on the internet.
Once you've obtained the shapefile, open your geolocated image in SeaDAS, then under the menu go to:
Vector > Import > Shapefile and select the shapefile.
The border lines will then be accessible in the Layer Manager.
Danny
MODIS aqua level 3 chl-a data processing
Giovanni can often provide very quick results, but often has constraints that limit you to suboptimal choices. A typical use case is to generate a time series for your region of interest to see if there are enough data (think cloud-free areas inthe individual passes) to support the calculation you want to perform. It can be much faster than manually scanning browse images or downloading the passes and trying your calculation using SeaDAS (GPF and or the OCSSW processing system).
SNAP uses a different underlying library for the GUI which is often faster than the SeaDAS GUI (less time loading images) and some new features that will eventually be in SeaDAS (Graph Builder GUI, more GPF operators, etc.). Some people find SNAP has fewer crashes in their PC, others find fewer problems in SeaDAS. Some of that may be the graphics hardware and drivers installed in their systems, and some may be lack of familiarity with the details of the interfaces. SeaDAS has the OCSSW Processing Tools GUI and a different color table GUI. Unless you are tight on disk space you can install both SNAP and SeaDAS on the same PC and see which you prefer.
SNAP uses a different underlying library for the GUI which is often faster than the SeaDAS GUI (less time loading images) and some new features that will eventually be in SeaDAS (Graph Builder GUI, more GPF operators, etc.). Some people find SNAP has fewer crashes in their PC, others find fewer problems in SeaDAS. Some of that may be the graphics hardware and drivers installed in their systems, and some may be lack of familiarity with the details of the interfaces. SeaDAS has the OCSSW Processing Tools GUI and a different color table GUI. Unless you are tight on disk space you can install both SNAP and SeaDAS on the same PC and see which you prefer.
MODIS aqua level 3 chl-a data processing
Hello gnwiii,
Again thanks for your reliable suggestion. I will try both seaDAS and SNAP. I previously tried giovanni, but cant find monthly average level-3 mapped chlorophyll concentration data. Do you have the link ?
Again thanks for your reliable suggestion. I will try both seaDAS and SNAP. I previously tried giovanni, but cant find monthly average level-3 mapped chlorophyll concentration data. Do you have the link ?