Page 1 of 1
Draw polygon on a scatter plot in SeaDAS
Posted: Tue Dec 29, 2020 7:02 pm America/New_York
by megasaputra8
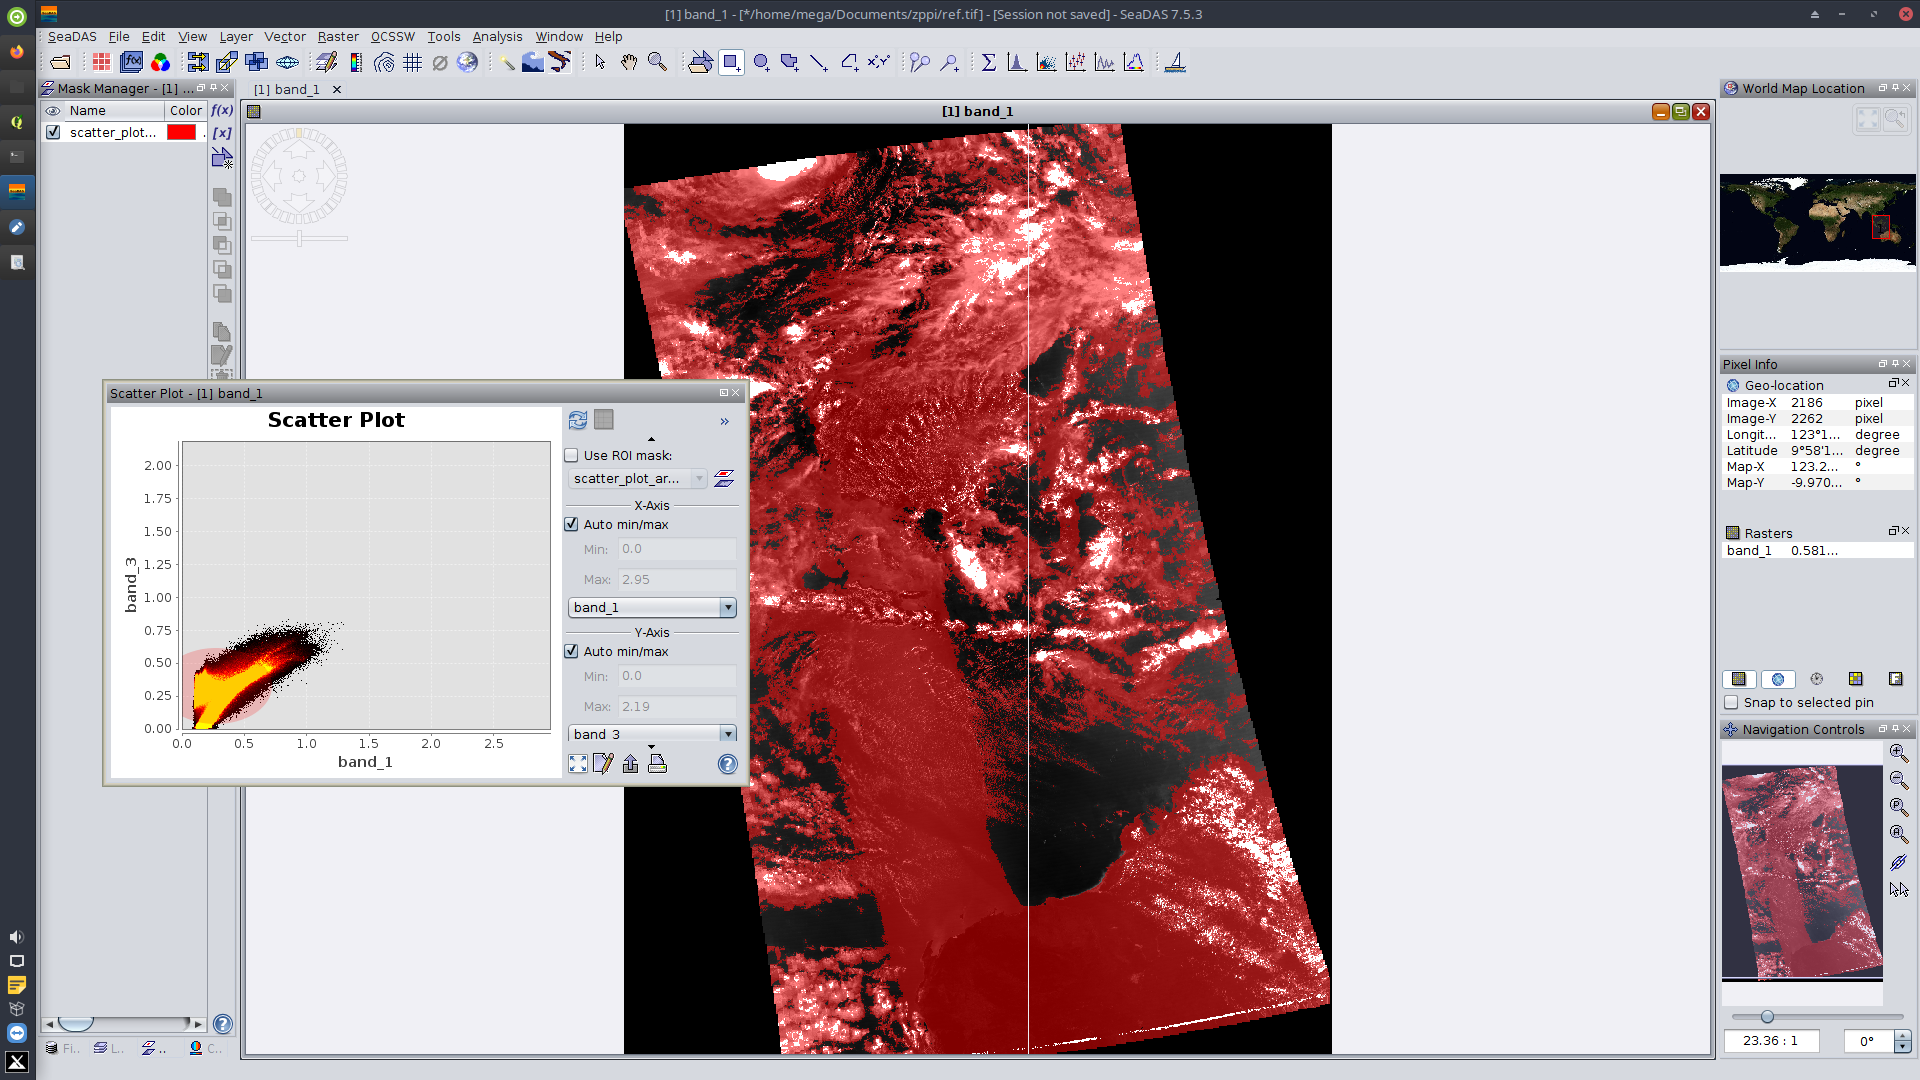
I want to create free polygon in a scatter plot in SeaDAS. In the menu, there are many choices like rectangle drawing tool, ellipse drawing tool, and polygon drawing tool. But, when I select rectangle drawing tool or polygon drawing tool, and I draw in a scatter plot, the result is ellipse. You can see in the attachment. So, how to solve this?
I install SeaDAS in MX Linux 19.3.
Draw polygon on a scatter plot in SeaDAS
Posted: Tue Dec 29, 2020 9:32 pm America/New_York
by gnwiii
From the scatterplot help entry:
Select Mask 'scatter_plot_area'
Allows the user to create a mask from the scatter plot. After selecting the menu entry, an elliptical selection frame can be created by clicking into the plot, dragging, and releasing. The mask will be created according to the values selected, and will immediately be selected.
If you want to annotate the scatterplot you should save an image and use image editing software, or export the data to a more suitable application.
Draw polygon on a scatter plot in SeaDAS
Posted: Tue Dec 29, 2020 10:42 pm America/New_York
by megasaputra8
Yes, I know that way. But, how to create free polygon from scatter plot?
Because, when I dragging, the result is ellipse. Not polygon.
Draw polygon on a scatter plot in SeaDAS
Posted: Wed Dec 30, 2020 6:59 am America/New_York
by gnwiii
The drawing tools only apply to the product image windows, so you will have to create your desired image with 3rd party tools. There are only a few SeaDAS developers, so it is best if they focus on the remote sensing capabilities (support for new sensors and algorithms) you can't get from widely used general-purpose software.
Draw polygon on a scatter plot in SeaDAS
Posted: Mon Jan 04, 2021 12:01 am America/New_York
by megasaputra8
Ok. Thanks
Draw polygon on a scatter plot in SeaDAS
Posted: Thu Jan 07, 2021 9:18 am America/New_York
by OB SeaDAS - knowles
The scatterplot is created from the image. You can mask areas of the image by drawing on the image using the polygon, ellipse, ... tools. You can then apply this mask to refine the scatterplot. However there are no tools in SeaDAS to enable the user to draw on the scatterplot and have that result transfer to the image.
Danny