i have this image A20173052017334.L3b_MO_CHL.nc
i have two working method which is the most reliable for anlayser the average of chlorophyll
The first :
Data images --> Cropped images --> Correction Preview images --> Vector Import shape file --> Export Mask Pixel --> Data Ascii --> Analyse mean Chlorophyll
The second :
Dta images --> Cropped--> correction Preview images --> L3bin processing --> L3mapgen --> Reprojecting --> L3bindump --> Data Ascii --> analyse mean chlorophyll
analyse mean chlorophyll
-
OB WebDev - norman
- Subject Matter Expert

- Posts: 143
- Joined: Tue Feb 09, 2021 8:19 am America/New_York
analyse mean chlorophyll
Hi,
If I were you, I would choose your second method but leave out
the L3mapgen and reprojecting steps. The L3bindump program
reads level-3 bin files directly, so you do not need to make mapped
versions of the data.
Regards,
Norman
If I were you, I would choose your second method but leave out
the L3mapgen and reprojecting steps. The L3bindump program
reads level-3 bin files directly, so you do not need to make mapped
versions of the data.
Regards,
Norman
analyse mean chlorophyll
hi
I chose your suggetion of the file directly the program l3bindump for the image A20173052017334.L3b_MO_CHL.nc but first it does not work, it tells me error of parametrage but the problem is that: my need is:
to have a mapped image of my region and to extract the average of cholorohylle at the same time,
how do i do to have pixel x and y longitude and latitude and mean chl-a
is it the right method
think's
-
OB WebDev - norman
- Subject Matter Expert
- Posts: 143
- Joined: Tue Feb 09, 2021 8:19 am America/New_York
analyse mean chlorophyll
There are many ways to handle the output of l3bindump.
Here is one that I would use involving Perl to parse the l3bindump output.
I just picked an arbitrary region using the file you specified since you weren't
specific about the type of problem you were encountering. I hope this is helpful.
Norman
P.S. I am also attaching the color palette table (cpt) that I used to color the
chlorophyll image.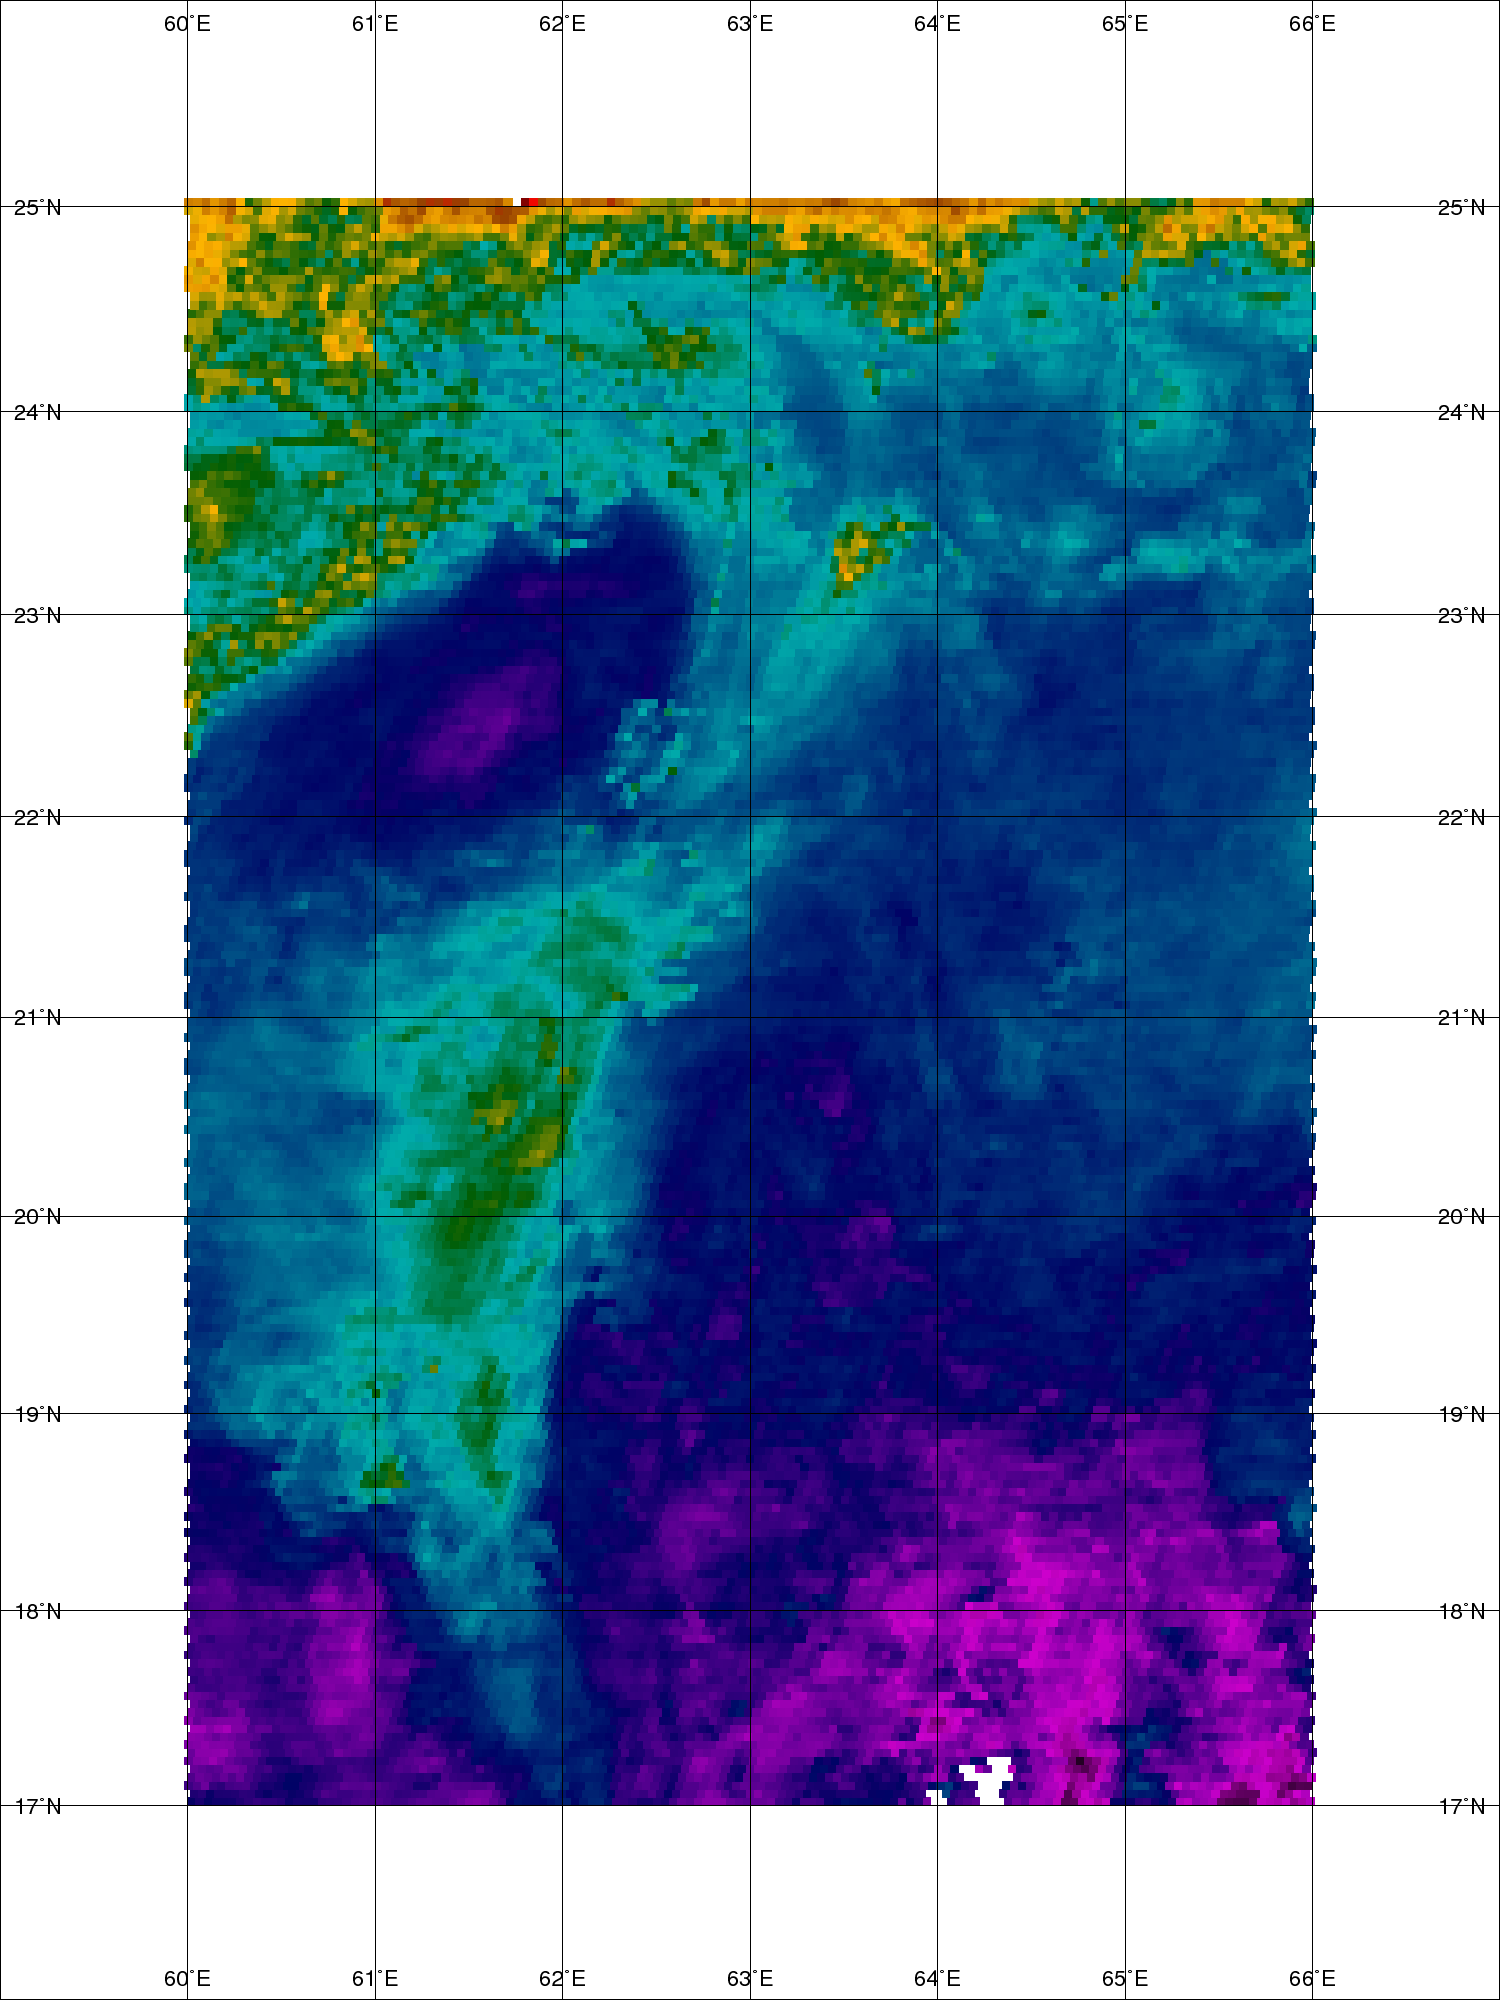
Here is one that I would use involving Perl to parse the l3bindump output.
# To get the mean value of chlorophyll concentration for an arbitrary region.
l3bindump ifile=A20173052017334.L3b_MO_CHL.nc l3bprod=chlor_a \
          north=25 south=17 west=60 east=66 \
| perl \
-e '<STDIN>;<STDIN>;<STDIN>;' \
-e 'while(<STDIN>){' \
-e '  $s+=(split " ")[12];' \
-e '  $n++;' \
-e '}' \
-e '$mean=sprintf "%.3f",$s/$n;' \
-e 'print "mean chlor_a = $mean milligrams per cubic meter\n";'

# The above commandline prints out the following.
mean chlor_a = 0.911 milligrams per cubic meter

# To make a colored image of the extracted region, I would use
# gmt, gs, and convert to generate the attached PNG image.
l3bindump ifile=A20173052017334.L3b_MO_CHL.nc l3bprod=chlor_a \
          north=25 south=17 west=60 east=66 \
| perl \
-e '<STDIN>;<STDIN>;<STDIN>;' \
-e 'while(<STDIN>){' \
-e '  ($n,$s,$w,$e,$chl)=(split " ")[3,4,5,6,12];' \
-e '  print "> -Z$chl\n$w $n\n$e $n\n$e $s\n$w $s\n";' \
-e '}' \
| gmt psxy -Cchl.cpt -L -R59/67/16/26 -JM15 -P -X0 -Y0 -B1g1 \
      --FORMAT_GEO_MAP=DF --FONT=16p --MAP_FRAME_TYPE=inside \
| gs -sDEVICE=ppmraw -sOutputFile=- -q -r100 -g1500x2000 -dTextAlphaBits=4 - \
| convert - regional_chl.png
I just picked an arbitrary region using the file you specified since you weren't
specific about the type of problem you were encountering. I hope this is helpful.
Norman
P.S. I am also attaching the color palette table (cpt) that I used to color the
chlorophyll image.