Page 1 of 1
Correlative plot
Posted: Sun Sep 16, 2018 12:45 pm America/New_York
by africaflores
Hi again,
I have a few questions to interpret the information from the Correlative Plot tool in SeaDAS, when used with chl-a product, satellite derived and in situ data:
1) The Box size: this selects the number of pixels (box size of 3, means a 3x3 box of pixels) from which the derived satellite value is going to be used in the plot. If one, that means the pixel value that exactly overlaps with the in situ measurement is going to be used.
2) The resulting table, on which the plot is based: chl-a-mean, is the mean chl-a value of the pixels defined in the box size.
chl-a-sigma is the standard deviation of the set of chl-a values contained in the box size
all the fields that end with "_ref" correspond to the original in situ data.
Thank you again. This maybe very self explanatory for you, I just want to make sure I'm understanding everything correctly.
Best regards,
Africa F.
Correlative plot
Posted: Mon Sep 17, 2018 10:35 am America/New_York
by OB SeaDAS - knowles
Yes this is correct. But regarding box size, instead of saying "If one, that means the pixel value that exactly overlaps with the in situ measurement", it would be more accurate to say something like "If one, that means the pixel value that best or closest overlaps with the in situ measurement". In situ points can easily be between satellite pixels or in a region where two adjacent satellite pixels overlap.
Danny
Correlative plot
Posted: Mon Sep 17, 2018 11:23 am America/New_York
by OB SeaDAS - knowles
Regarding this topic of in situ and satellite matchups, it is important that users who want to publish and cite results use the appropriate tools in citable ways.
The tool (Correlative Plot) isn't designed for and cannot precisely replicate the official matchup methodology used by OBPG in generating SeaBASS/satellite matchups. The closest this particular tool can get (regarding level2 file matchups) would be acheived by using a box size of 5 and ROI mask = "!ATMFAIL && !LAND && !HIGLINT && !HILT && !HISATZEN && !STRAYLIGHT && !CLCIDE && !HISOLZEN && !LOWLW && !CHLFAIL && !NAVWARN && !NAVFAIL && !FILTER".
However the Correlative Plot tool is missing (at least currently) 3 components of the SeaBASS matchup methodology: time difference, percent minimum valid satellite pixels, and maximum coefficient of variation of satellite pixels.
SeaDAS does contain the official OBPG SeaBASS matchup tool. However it is only available on the command line and is not currently available within the GUI. This tool is:
mk_matchup.py and can be found within the SeaDAS/OCSSW installation.
An example run of this tool would look like this:
mk_matchup.py --sat_file A2010317175500.L2_LAC_OC.nc --seabass_file=CV5_OM_pigments_seabass.txt --out_file=out.txt
The output file is the original SeaBASS file with the satellite matchups appended as columns. For instance, since chlor_a is a product in the satellite file, you get 2 new columns for that product "modis_aqua_chlor_a" and "modis_aqua_chlor_a_sd" which are the matchup validated satellite data mean and standard deviation respectively.
The citable reference used by mk_matchup.py is:
See: Bailey, S.W., and Werdell, P.J. (2006). A multi-sensor approach for the on-orbit validation of ocean color satellite data products. Rem. Sens. Environ. 102, 12-23.
Also see:
https://seabass.gsfc.nasa.gov/search#valDanny
Re: Correlative plot
Posted: Tue Nov 09, 2021 8:49 am America/New_York
by avmehta
Hello Danny,
I am trying to get correlative plot for the attached image via SeaDAS GUI. In searching for some suggestions I found your message about correlative plots and data matching - but I am not sure how to make sure that invalid data (such as land pixels, atmfail, prodfail, seaice etc) are excluded in the correlative plot. Any help you can provide would be greatly appreciated.
Thank you.
Amita
Re: Correlative plot
Posted: Wed Nov 10, 2021 10:48 am America/New_York
by OB SeaDAS - knowles
The Correlative Plot tool has a ROI mask checkbox. So you use this to specify your ROI mask(s). Note that this is ROI (region of interest) and not a flag masking selection. The best approach would be to create a new quality mask via the Mask Manager, which is to be treated as a ROI mask. You can then select both a quality mask and a vector regional shape mask as your ROI in the Correlative Plot tool. For instance the Mask Manager expression to create a mask which I named "Quality Mask":
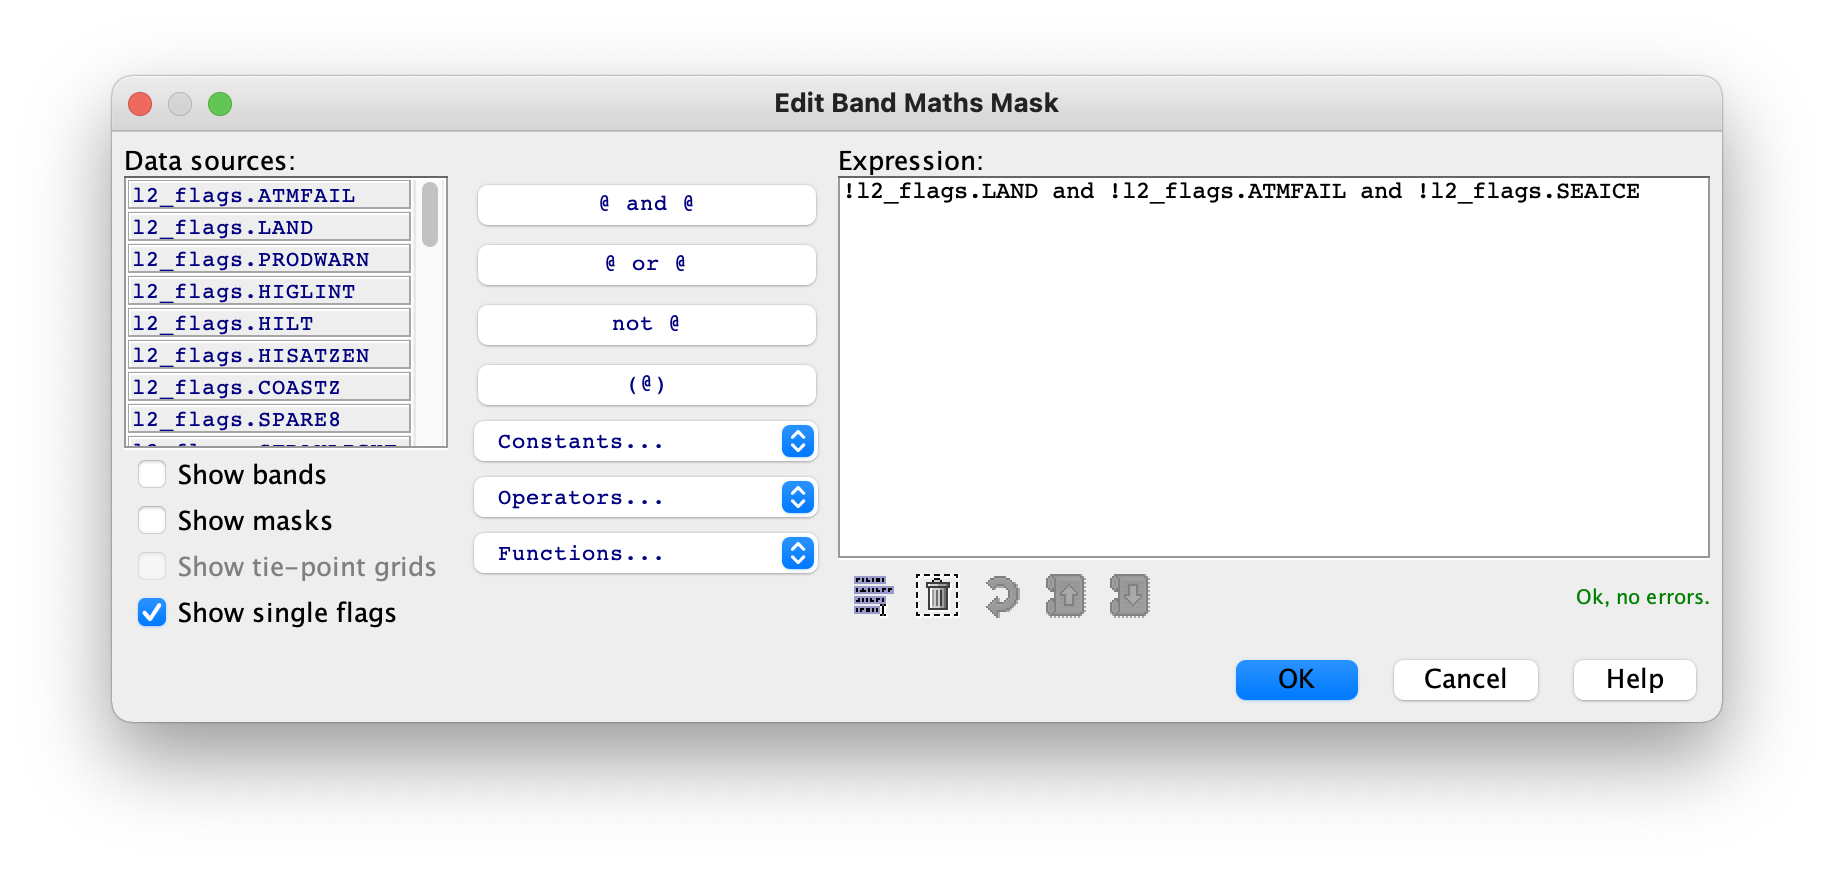
- mask_manager.png (338.26 KiB) Not viewed yet

- correlative_plot.png (390.36 KiB) Not viewed yet
Re: Correlative plot
Posted: Thu Nov 11, 2021 9:14 am America/New_York
by avmehta
Thank you Danny. That works.
Best,
Amita