
Primarily, the vertically resolved data are segregated by time progressing from the entire length of the mission to-date to monthly zonal means, to weekly curtains and culminating in daily groupings of individual profiles. The monthly zonal means combine both sunrise and sunset events, while all other images are grouped by the rising or setting of the sun as seen from the ISS. For all but a few days a year, the type of solar events are the same at the ground/atmosphere as they are from the ISS.
“The team designed the portal to display our data in images covering timescales including days, weeks, and months to tailor the experience for users wanting to deep dive into specific events or to get a broader overview of how SAGE III has observed changes in our atmosphere,” said SAGE III Lead Data Scientist Kevin Leavor.
There are two streams of data to view: publicly released (original data is available at the Atmospheric Science Data Center) and expedited pre-release results. The main difference between the two streams is the latency, which in turn is driven by the availability of ancillary meteorological inputs.
SAGE III takes measurements across the globe using a technique called occultation, which involves looking at the light from the Sun or Moon as it passes through Earth’s atmosphere at the edge, or limb, of the planet. Every time the sun, or moon, rises and sets, SAGE uses the light that passes through the atmosphere to measure gases and particles in that region of the atmosphere.
The ISS provides a unique vantage point from which to take these measurements. The coverage from the ISS occurs over 30 times per day, taking about a month to cover the Southern Hemisphere, tropics, and Northern Hemisphere.
The figures below highlight some of the views available for the released solar data products. Figure 1, from the latitude band of Hunga Tonga – Hunga Ha’apai (HTHH), illustrates the initial appearance of the HTHH aerosol layer and its descent driven mainly by gravitational settling. Figures 2 and 3 are monthly zonal averages for the monthly data update in April 2023. The HTHH aerosol layer is mainly within the Southern Hemisphere, but has also spread to the Northern Hemisphere. The HTHH water layer has been distributed globally, more equally than the aerosol layer.
“We provide all of our species including gases, aerosols, and derived aerosol extinction ratios to leverage SAGE III’s strengths for our users, and visualize that information at a glance,” said Leavor. “Zonal regions are highlighted in our Mission Overviews to emphasize atmospheric events that have occurred over the entire coverage extent of the mission.”
This great addition to the mission website represents many hours of development by the SAGE III/ISS web and visualization teams.
“The SAGE III/ISS team hopes that this website is a tool for users to easily engage with science data produced by our mission. We are proud of our data product and what we’ve been able to do with it, and we want to share that with everyone,” said Leavor.
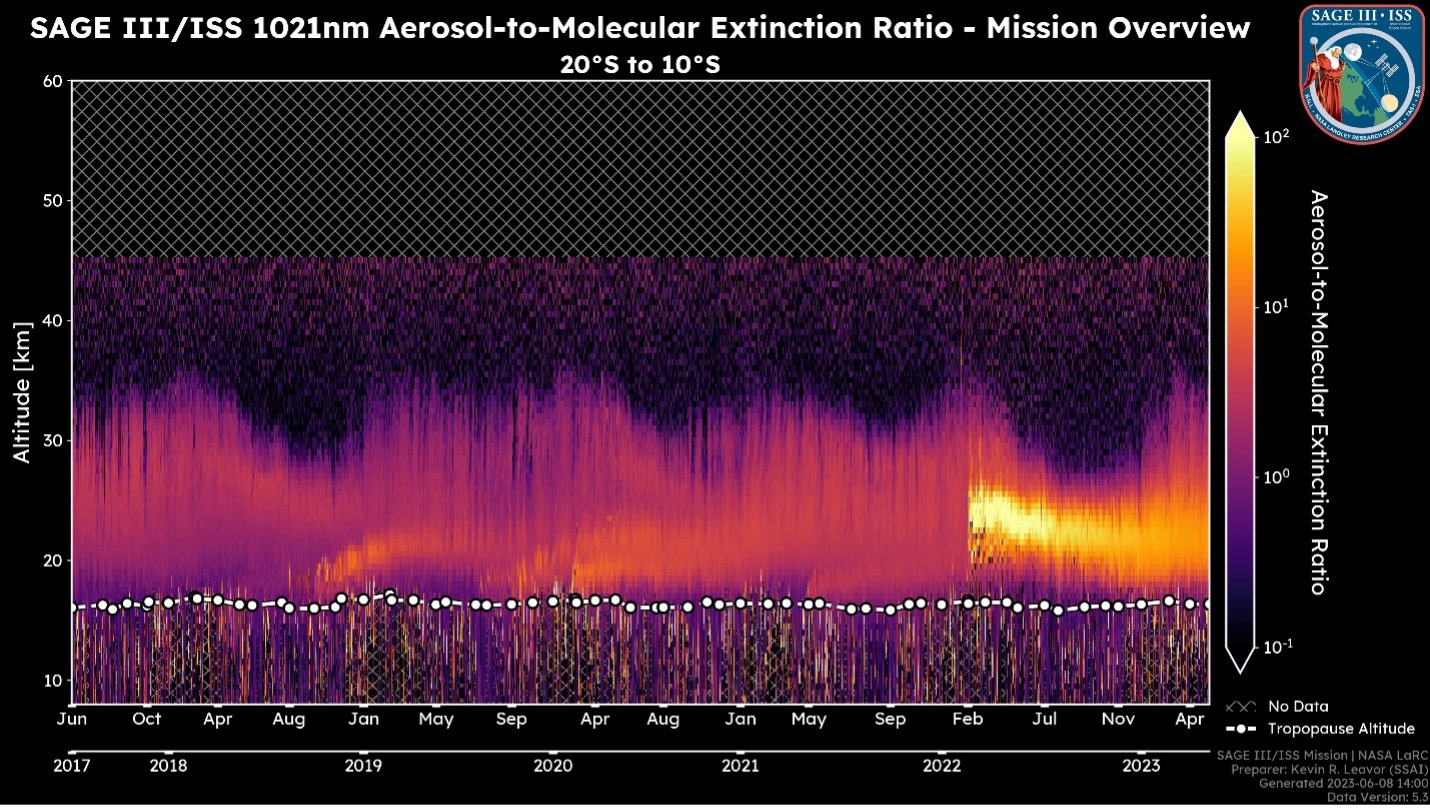
| Figure 1 |
|---|
| Mission summary 1021 nm aerosol-to-molecular extinction ratio for latitude band 10S to 20S that is available from the Quicklook portal. Several perturbations from episodic terrestrial events, notably the Jan. 2022 eruption of Hunga Tonga – Hunga Ha’apai. The ratio of how much the aerosol particles scatter light compared to the molecules in the air (like nitrogen and oxygen) is what scientists call the aerosol-to-molecular extinction ratio. This ratio can vary depending on the type and amount of particles present in the air, and it can be used to estimate the concentration of particles in the atmosphere, which is important for understanding air quality and climate change. |
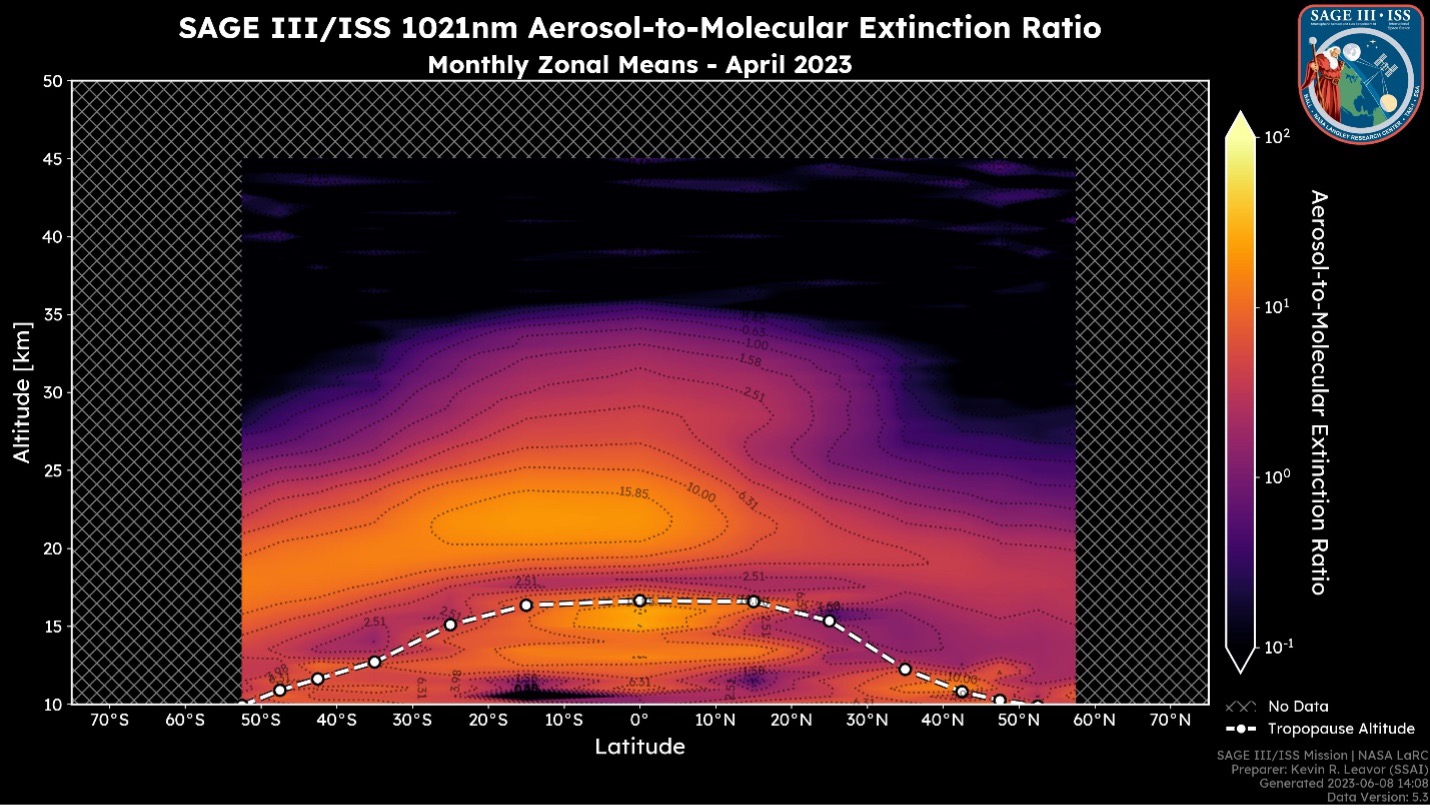
| Figure 2 |
|---|
| April 2023 aerosol-to-molecular extinction ratio for 1021 nm. |
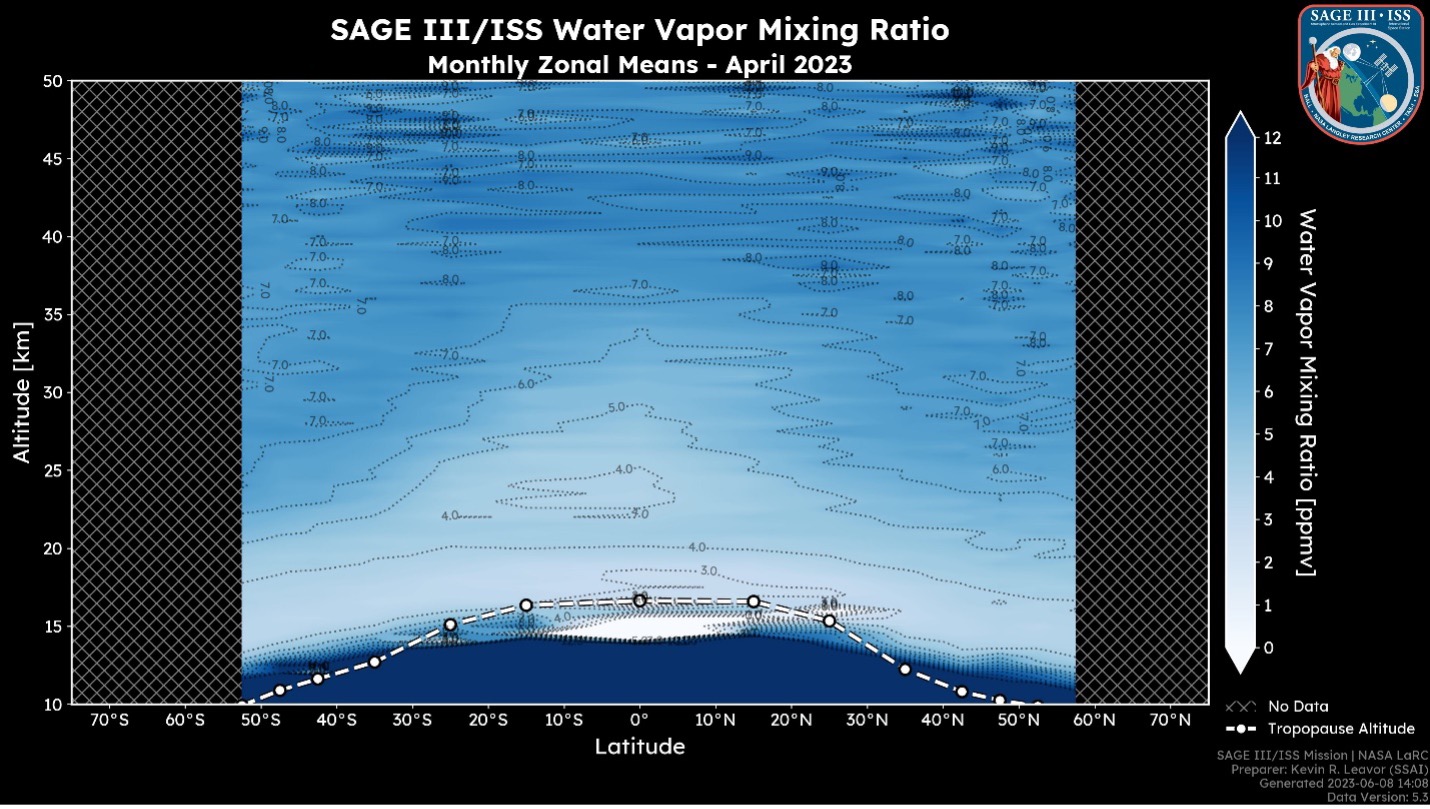
| Figure 3 |
|---|
| Water vapor mixing ratio for April 2023. Water vapor mixing ratio is a way to measure the amount of moisture or humidity present in the air. It is defined as the mass of water vapor present in a unit of dry air. |