Hello,
I am trying to plot the total backscatter and I used one of the example codes from the website however, my plot doesn't seem right and I can't fix it.
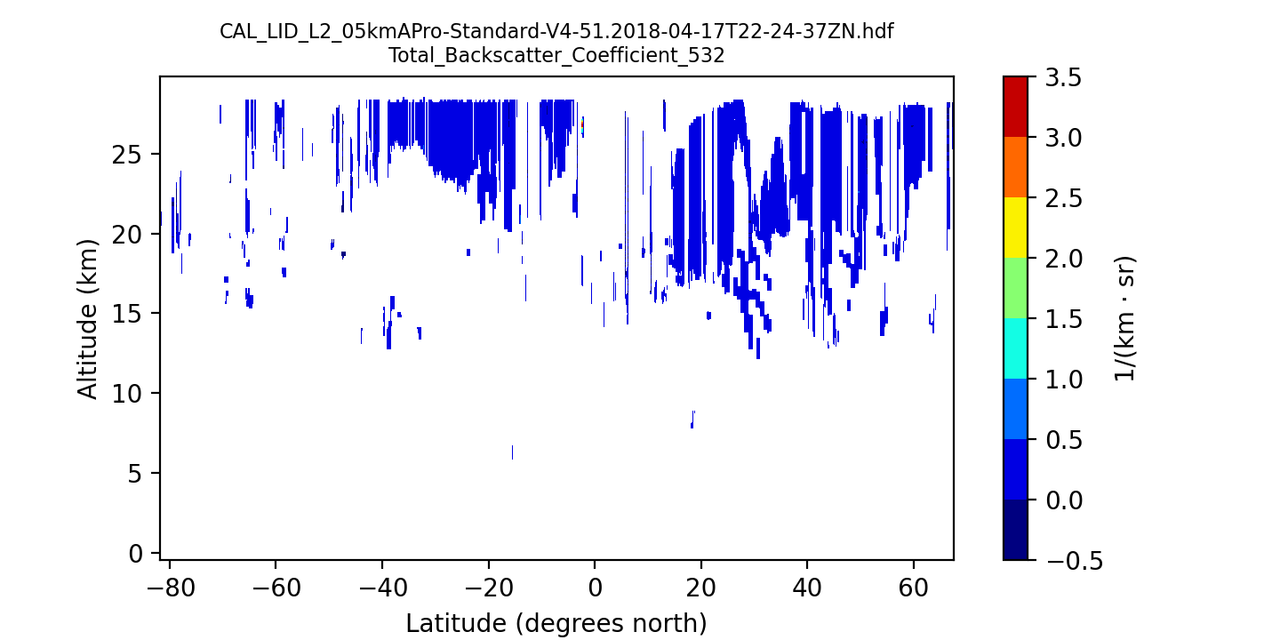
the problem I am facing is that the plot has a lot of gaps and is flipped to the altitude. no data is plotted from 0 - 15 km altitudes.
this is the file's name 'CAL_LID_L2_05kmAPro-Standard-V4-51.2018-04-17T22-24-37ZN.hdf'
Please help.
I got the example from here viewtopic.php?t=4222
Plotting Total Backscatter Coefficient 532
-
salbloos27
- Posts: 5
- Joined: Tue Jan 30, 2024 6:37 am America/New_York
Plotting Total Backscatter Coefficient 532
- Attachments
-
- Untitled (copy).png (28.22 KiB) Not viewed yet
Tags:
-
ASDC - cheyenne.e.land
- Subject Matter Expert

- Posts: 131
- Joined: Mon Mar 22, 2021 3:55 pm America/New_York
- Has thanked: 1 time
- Been thanked: 8 times
Re: Plotting Total Backscatter Coefficient 532
Hello,
Thank you for your interest in CALIPSO data.
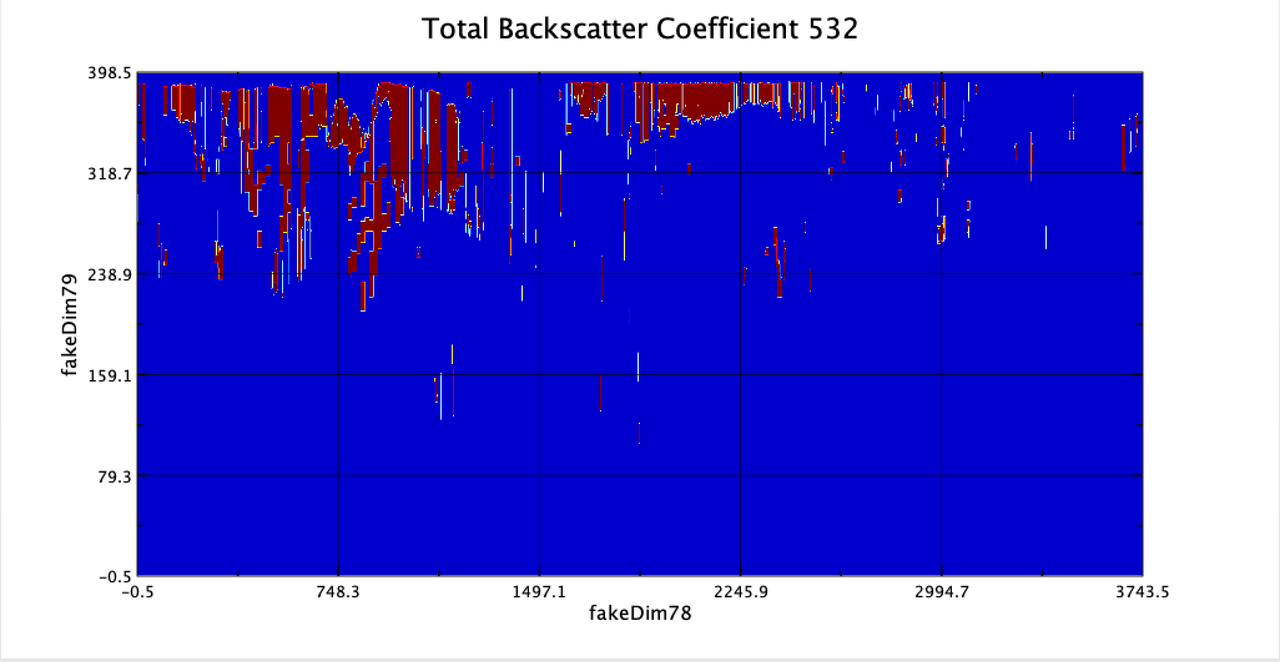
It appears that there is nothing wrong with your plot. You can verify this if you open the file in Panoply. Looking at the data there is a lot of fill values especially in the lower altitudes like you mentioned (0 - 15 km).
Regards,
ASDC
Thank you for your interest in CALIPSO data.
It appears that there is nothing wrong with your plot. You can verify this if you open the file in Panoply. Looking at the data there is a lot of fill values especially in the lower altitudes like you mentioned (0 - 15 km).
Regards,
ASDC
-
salbloos27
- Posts: 5
- Joined: Tue Jan 30, 2024 6:37 am America/New_York
Re: Plotting Total Backscatter Coefficient 532
It doesn't look right to me, when plotting line plot for each of the data of total backscatter vs. altitude we can see that in lower altitudes there are a lot of values. also the quick looks in CALIPSO website shows something different than what I got.
if there is any code that I can use to plot the backscatter please provide it to me.
Thank you,
if there is any code that I can use to plot the backscatter please provide it to me.
Thank you,
-
ASDC - cheyenne.e.land
- Subject Matter Expert
- Posts: 131
- Joined: Mon Mar 22, 2021 3:55 pm America/New_York
- Has thanked: 1 time
- Been thanked: 8 times
Re: Plotting Total Backscatter Coefficient 532
Hello,
That user specifically wanted to subset the data at a specific range of latitudes.
Here is what the plot looks like when graphed at all latitudes:
Here is what the plot looks like when opened in Panoply (note: it is flipped). Panoply is a Panoply plots geo-referenced and other arrays from netCDF, HDF and other datasets.