
If you wish to view the VIIRS reflectance imagery that corresponds to the active fire detections, you can display this in FIRMS Fire Map or Worldview.
What is the VIIRS 375 m Active Fire Product?
The VIIRS 375 m (VNP14IMGTDL_NRT) active fire product is the latest product to be added to FIRMS. It provides data from the Visible Infrared Imaging Radiometer Suite (VIIRS) sensor aboard the joint NASA/NOAA Suomi National Polar-orbiting Partnership (Suomi NPP) and NOAA-20 satellites. The 375 m data complements MODIS fire detections, show good agreement in hotspot detection, but the improved spatial resolution of the 375 m data provides greater response over fires of relatively small area, and improved mapping of large fire perimeters. The 375 m data also has improved nighttime performance. Consequently, these data are well suited for use in support of fire management (e.g., near real-time alert systems), as well as other science applications requiring improved fire mapping fidelity.
What is the temporal frequency of the VIIRS 375 m fire data?
The VIIRS instrument aboard the Suomi NPP and NOAA-20 satellites acquire data continuously. The 3,040 km VIIRS swath enables ≈15% image overlap between consecutive orbits at the equator, thereby providing full global coverage every 12 hours. Suomi NPP has a nominal (equator-crossing) observation times at 1:30 p.m. and 1:30 a.m., Mean Local Time (MLT); NOAA-20 operates about 50 minutes ahead of Suomi NPP. The mid-latitudes experience 3-4 looks a day as these are polar-orbiting satellite.
What is the spatial resolution of the data?
The 375 m data describe the nominal resolution after native data are spatially aggregated (see figure below).
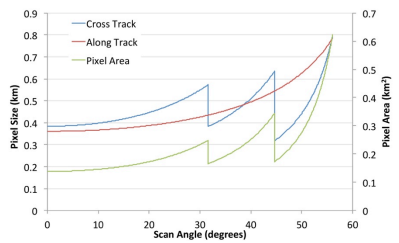
Spatial resolution of VIIRS imagery data as a function of scan angle. The three distinct regions represent unique data aggregation zones extending from nadir to the edge of swath.
The aggregation scheme changes across three distinct image regions. In the first region (nadir to 31.59° scan angle), three native pixels are aggregated in the along scan (cross-track) direction to form one data sample in the Level 1 image. In the second region (31.59° to 44.68° scan angle), two native pixels are aggregated to form one data sample. Finally in the third and last region (44.68° to 56.06° - edge of swath) one native pixel will result in one data sample. All five 375 m channels are aggregated onboard the spacecraft before the data are transmitted to the ground stations, whereas a subset of the VIIRS 750 m data (dual-gain channels only) are aggregated on the ground.
What is the main difference between the VIIRS 375 m and 750 m active fire data?
The two data products use similar methodologies to detect active fire pixels although differences in the spectral characteristics of the VIIRS channels used in each case led to unique algorithms. Because of its improved spatial resolution, the 375 m algorithm will tend to detect more fire pixels compared to the 750 m data set. That difference is particularly pronounced during the nighttime part of the orbit when the occurrence of smaller/cooler fires will favor the 375 m product.
Will the VIIRS 375 m fire detection algorithm always outperform the 750 m one?
Generally, the higher resolution product will achieve a higher probability of fire detection in both day and nighttime scenes. However, areas subject to strong solar reflectance associated with sun glint, such as metallic rooftops or highly reflective desert, could see a few 750 m fire pixels without a corresponding 375 m fire detection. This is attributed to the relatively shorter wavelength of the 375 m mid-infrared channel used in the fire algorithm, which will experience greater influence of the solar component. To minimize the associated consequences, namely the occurrence of false alarms over bright/reflective surfaces (e.g., metallic factory rooftops), the 375 m algorithm uses slightly more conservative tests to avoid the effects of Sun glint over those areas.
Are those few isolated fire pixels in the middle of the South Atlantic Ocean real?
Those occurrences are typically associated with spurious fire detections due to the South Atlantic Magnetic Anomaly. The 375 m active fire algorithm contains a specific filter to flag those occurrences as low confidence detections. However, in some cases (average 2-3 pixels every night) the spurious signal generated in the input Level 1 data is confused for a regular fire pixel and therefore assigned a nominal confidence flag. Note that verified true positives can be found over South Atlantic Ocean waters along the southeast coast of Brazil and the west coast of Africa where oil rigs normally operate.
Are the VIIRS 375 m (and 750 m) active fire data science-ready?
The VIIRS active fire data have been extensively tested since routine production of the mission’s data record started January 19, 2012. Numerous bad scan episodes (i.e., pixel clusters containing spurious radiances extending across the swath) were found in the Level 1 input data during the initial 18-24 months of the time series (Csiszar, et al., 2014). Those anomalies were gradually addressed by the VIIRS science team and their occurrence has dropped to virtually zero with the implementation of revised Level 1 data processing packages in 2015. Initial assessment of both VIIRS 375 m and 750 m was implemented over a few experimental sites indicating consistent fire detection and characterization performance. Additional data comparison analyses were implemented using near coincident Aqua/MODIS and TET-1 (German Aerospace Center) active fire data, which again showed consistent performance of the VIIRS active fire products across different observation conditions. Consequently, we consider the current data of good enough quality for use in fire management applications and scientific studies.
Where do I go for more information?
Schroeder, W., Oliva, P., Giglio, L., & Csiszar, I. A. (2014). The New VIIRS 375m active fire detection data product: Algorithm description and initial assessment. Remote Sensing of Environment, 143: 85–96. doi:10.1016/j.rse.2013.12.008
https://earthdata.nasa.gov/earth-observation-data/near-real-time/firms/viirs-i-band-active-fire-data
http://viirsfire.geog.umd.edu/
https://earthdata.nasa.gov/earth-observation-data/near-real-time/firms/v1-vnp14imgt