
Geostationary satellite sensors view the same area of Earth’s surface at all times while polar-orbiting sensors, such as MODIS and VIIRS, typically view the same area of Earth’s surface twice daily. Consequently, geostationary satellite sensors can provide repeated observations on a sub-hourly basis, making it possible to detect fires which may not be detected at longer temporal intervals. Geostationary satellites provide data at 10-15 minute intervals, so they can detect more fire events and capture their growth and change. However, the spatial resolution of geostationary satellite data is coarser and therefore less sensitive to small fires.
Where does the geostationary active fire data come from and how can I get more information about them?
Please refer to the following references and the information in the table below:
| Satellite | GOES-16, GOES-18 | GOES-16, GOES-18 | Meteosat 9 & 11 | Himawari-8 |
|---|---|---|---|---|
| Instrument/Algorithm | Advanced Baseline Imager (ABI) / Fire Detection and Characterization (FDC-HSC) | Advanced Baseline Imager (ABI) / Fire Radiative Power (FRP-PIXEL) | Spinning Enhanced Visible and Infra-Red Imager (SEVIRI) / Fire Radiative Power (FRP-PIXEL) | Advanced Himawari Imager (AHI) / Fire Radiative Power (FRP-PIXEL) |
| Satellite Source Agency | NOAA | NOAA | EUMETSAT | JAXA |
| Data Source | NOAA CLASS | Instituto Português do Mar e da Atmosfer (IPMA) under Copernicus Atmosphere Monitoring Service (CAMS) | EUMETSAT Land Surface Analysis Applications Facility (LSA SAF) | IPMA under Copernicus Atmosphere Monitoring Service (CAMS) |
| Coverage and Satellite Locations* | Americas East and West GOES-16: 0º, -75.2º GOES-18: 0º, -137.2º |
Americas East and West GOES-16: 0º, -75.2º GOES-18: 0º, -137.2º |
Europe, Africa and Asia Meteosat 9 (IODC): 0º, 45.5º, Meteosat 11: 0º, 0º |
Asia and Australia Himawari 8: 0º, 140º |
| More Information/Product User Manual (PUM) | NOAA GOES-R Series Advanced Baseline Imager (ABI) Level 2 Fire / Hot Spot Characterization (FDC) - Datasets GOES FDC User Guide |
FRP: GOES-R and Himawari Satellites PUM See Xu et al. (2021) |
Fire Radiative Power Pixel (FRPPIXEL, LSA-502) See Wooster et al. (2015): See Roberts et al. (2015) |
FRP: GOES-R and Himawari Satellites PUM See Xu et al. (2021) |
| Algorithm | Filtered Fire Detection and Characterization (FDC-HSC) algorithm (provisional) (Schmidt et al., 2013). See: Why are the geostationary fire data filtered in FIRMS?(below) | Geostationary Fire Thermal Anomaly (FTA) algorithm & FRP retrieval developed by King’s College, London. See Xu et al. (2021) | Geostationary Fire Thermal Anomaly (FTA) algorithm & FRP retrieval developed by King’s College, London. See Wooster et al. (2015) | Geostationary Fire Thermal Anomaly (FTA) algorithm & FRP retrieval developed by King’s College, London. See Xu et at. (2017) |
What are the attributes of the geostationary fire data?
The attributes are described in the following table:
| Attribute | Short Description | Long Description |
|---|---|---|
| Latitude | Latitude (decimal degrees) | Latitude of pixel center. Note: Pixel size/dimension is affected by satellite view geometry and curvature of Earth’s surface. Consequently, pixel size becomes more distorted (larger) with increasing distance from the point immediately below the satellite. The reported coordinate is the center of each pixel’s footprint. See: What is the spatial resolution of the geostationary satellite observations?(see below) |
| Longitude | Longitude (decimal degrees) | Longitude of pixel center. Note: Pixel size/dimension is affected by satellite view geometry and curvature of Earth’s surface. Consequently, pixel size becomes more distorted (larger) with increasing distance from the point immediately below the satellite. The reported coordinate is the center of each pixel’s footprint. See: What is the spatial resolution of the geostationary satellite observations?(see below) |
| Brightness | Brightness Temperature (BT) (kelvins) | Middle-infrared channel BT (kelvins) No BT values are output from the FDC algorithm indicated by -999 |
| Pixel_Y | Pixel size (E-W direction) | These values reflect the approximate pixel size. |
| Pixel_X | Pixel size (N-S direction) | These values reflect the approximate pixel size. |
| Acquire_Time | Time and date of start of scan | Scan start time. The format is YYYY-MM-DD followed by HH:MM. For example, the time 12:14 |
| Confidence | Confidence | FRP-PIXEL: Value range 0-1. Higher values correspond to higher detection confidences.
FDC-HSC: class values range from 10-15 and 30- 35 and are indicative, but not a measure of fire confidence level. The former sub-group defines instantaneous (first/single) fire detections whereas the latter identifies temporally-filtered cases when two or more co-located detections are observed within a 12-hour interval. FIRMS filters and displays only:
|
| Version | Version (FIRMS reference only) | 1.0 NRT |
| Brightness2 | Brightness Temperature (kelvins) | Long-wave infrared channel brightness temperature (kelvins) No BT values are output from the FDC algorithm indicated by -999 |
| FRP | Fire Radiative Power | FRP depicts the pixel-integrated fire radiative power in MW (megawatts). |
| Day/Night | Day or Night | D= Daytime fire, N= Nighttime fire |
| Satellite | Satellite |
|
- GOES active fire detections occur every 10 minutes and should be available within FIRMS in approximately 20-30 minutes.
- Meteosat active fire detections occur every 15 minutes and should be available within FIRMS in approximately 30 minutes.
- Himawari active fire detections occur every 10 minutes and should be available within FIRMS in approximately 30 minutes.
What size of fires can be detected with geostationary satellite observations?
GOES - The theoretical minimum detectable fire size is approximately 0.004 km2 (4,000m2) at nadir in optimum viewing conditions, burning at 800 K (Schmidt et al., 2013).
Meteosat - The theoretical minimum detectable fire size for “actively burning fires” is approximately 0.0001 of the area of a 3km SEVIRI pixel at nadir or approximately 0.0009km2 (900m2) (Schmidt et al., 2013).
Himawari - Documentation describing the minimum detectable fire size of Himawari AHI using JAXA's Wild Fire product algorithm is currently limited but performance is anticipated to be similar to GOES ABI. Several recent research efforts demonstrate the use of Himawari AHI using customized/adapted fire detection algorithms with varying results.
Please see the following papers:
Schmidt, C., Hoffman, J., Prins, E., and Lindstrom, S. (2013). GOES-R Advanced Baseline Imager (ABI) Algorithm Theoretical Basis Document For Fire/ Hot Spot Characterization v2.6. NOAA NESDIS STAR, https://www.star.nesdis.noaa.gov/goesr/documents/ATBDs/Baseline/ATBD_GOESR_FIRE_v2.6_Oct2013.pdf
Wooster, M. J., Roberts, G., Freeborn, P. H., Xu, W., Govaerts, Y., Beeby, R., He, J., Lattanzio, A., Fisher, D., and Mullen, R. (2015). LSA SAF Meteosat FRP products – Part 1: Algorithms, product contents, and analysis. Atmospheric Chemistry and Physics, 15(22): 13217–13239. doi:10.5194/acp-15-13217-2015
What is the spatial resolution of the geostationary satellite observations?
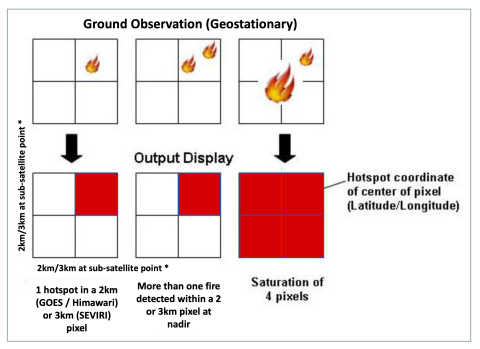
The thermal bands, used to detect active fires, have a spatial resolution directly below the satellite (known as the “sub-satellite point”) of 2km for GOES ABI and Himawari AHI, and 3km for Meteosat SEVIRI. However, as already noted, the spatial resolution of the pixel (i.e., the pixel size) systematically grows away from the sub-satellite point towards the edge of the disk (Figures 1-4). Please note each hotspot/active fire detection represents the center of a pixel flagged as containing one or more fires or other thermal anomalies (such as volcanoes).
Please note the pixel size systematically grows away from the sub-satellite point towards the edge of the disk (see Figures 1 - 4).
The following figures (Figures 1-4) illustrate how the spatial resolution of the geostationary satellites increases away from the sub-satellite point - please note all measurements are in km2.
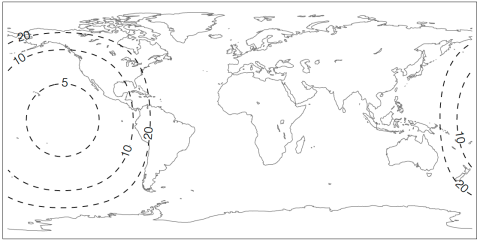
Figure 1. Coverage of GOES-18 indicating the variation in pixel area (in km²)
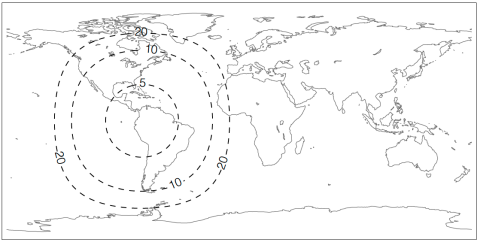
Figure 2. Coverage of GOES-16 indicating the variation in pixel area (in km²).
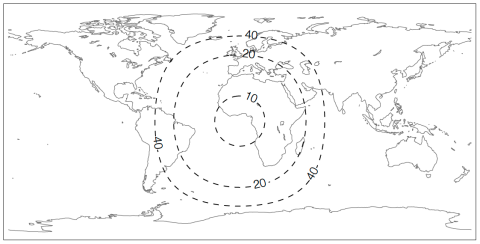
Figure 3. Coverage of Meteosat SEVIRI indicating the variation in pixel area (in km²).
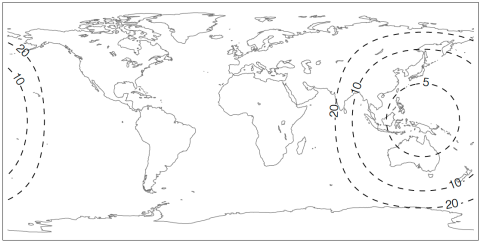
Figure 4. Coverage of Himawari-8 indicating the variation in pixel area (in km²).
Why are the geostationary fire data filtered in FIRMS?
While geostationary active fire data provide a much enhanced temporal frequency compared to active fire data generated from polar-orbiting satellites, active fire data from geostationary satellites can yield spurious detections. These can result from sun glint, bright water, bright deserts/soils, coastlines, and navigation inconsistencies resulting in positioning error, for example. The Meteosat SEVIRI and Himawari AHI data, made available from EUMETSAT and CAM, have a 65-degree view zenith angle cut-off due to the large pixel size at high latitudes.
The following images provide examples of where spurious fire detections from Meteosat SEVIRI have been noted.
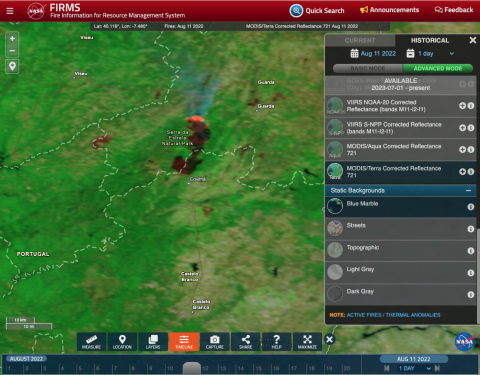
This series (1 of 3) of FIRMS screenshots, from August 11, 2022, show fires detected in the Serra da Estrela National Park, Portugal. This first screenshot shows a MODIS/Terra 7,2,1 Corrected Reflectance image with burned area in reddish-brown and an active fire front in orange (note: no active fires have been overlayed).
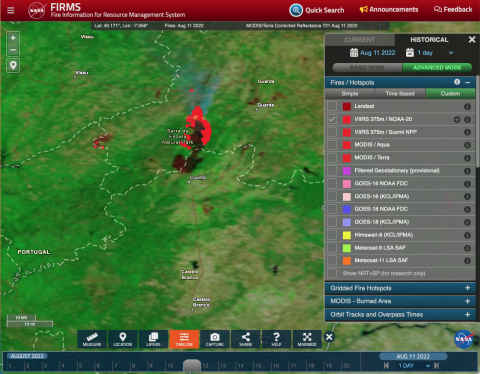
This second image in the series of FIRMS screenshots from August 11, 2022, shows fires detected in the Serra da Estrela National Park, Portugal. This screenshot shows a MODIS/Terra 7,2,1 Corrected Reflectance image, overlain with VIIRS active fire detections shown as red pixels.
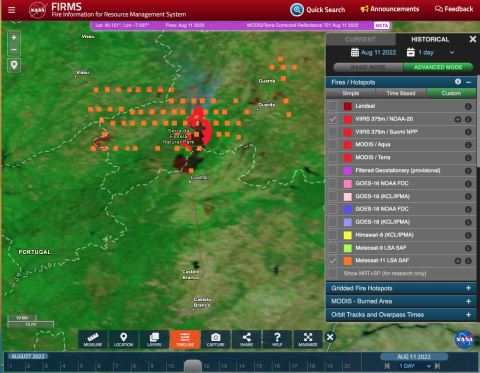
This third image in the series of FIRMS screenshots from August 11, 2022, shows fires detected in the Serra da Estrela National Park, Portugal. This third screenshot shows a MODIS/Terra 7,2,1 Corrected Reflectance image, overlain with VIIRS active fire detections shown as red pixels and Meteosat-11 SEVIRI FRP pixels shown as orange pixels. Some spurious SEVIRI fire detections are evident.
The Filtered Fire Detection and Characterization (FDC-HSC) algorithm used to produce the GOES-16 and GOES-18 active fire data from NOAA, is still under development. To limit false detections, the data shown in FIRMS are filtered to show only fire detections with higher confidence values; these are classes 10 and 30, and 11 and 31. These criteria are driven by the validation analysis (See Hall et al 2019) and a qualitative review of the current algorithm output. The full list of classes available is outlined in the table below:
| Class | Description |
|---|---|
| 10 or 30 | Good quality (highest confidence) fire detections** |
| 11 or 31 | Saturated fire pixel** |
| 12 or 32 | Cloud contaminated fire pixel |
| 13 or 33 | High probability fire pixels that do not satisfy requirements to be categorized as good quality fire detections |
| 14 or 34 | High probability fire pixels that do not satisfy requirements to be categorized as good quality fire detections |
| 15 or 35 | Low probability fire pixels that do not satisfy requirements to be categorized as good quality fire detections |
Our qualitative assessment indicates some spurious fire detections are showing (see example below). This could be due to sun glint, bright water, bright deserts/soil, coastlines and lake edges etc so users are requested to use the data with caution. If in doubt, we recommend users look for coincident fire detections from MODIS or VIIRS in the vicinity. If they are present, the user can have more confidence in the geostationary data.
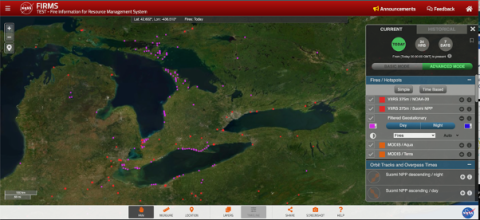
In this screenshot from FIRMS, on 15 July 2022, the GOES FDC data from NOAA (shown in pink) along the lake edge are thought to be false positives / spurious fire detections. Users should exercise caution when using the data.
What validation of geostationary active fire data has been conducted?
Satellite-derived active fire products are validated with spatially and temporally coincident observations from higher resolution sensors. Landsat and Sentinel-2 are both appropriate sensors for validating geostationary active fire products. Given the Landsat and Sentinel-2 overpass times, any validation efforts will be focused on certain times of the day and, therefore, false positives associated with unique solar angle issues, for example, may be missed.
Please see the following papers:
Hall, J. V., Zhang, R., Schroeder, W., Huang, C., & Giglio, L. (2019). Validation of GOES-16 ABI and MSG SEVIRI active fire products. International Journal of Applied Earth Observation and Geoinformation, 83, 101928. doi:10.1016/j.jag.2019.101928
Xu, W., Wooster, M.J., Kaneko, T., He, J., Zhang, T. and Fisher, D., 2017. Major advances in geostationary fire radiative power (FRP) retrieval over Asia and Australia stemming from use of Himawari-8 AHI. Remote Sensing of Environment, 193, pp.138-149. doi:10.1016/j.rse.2017.02.024
Xu, W., Wooster, M.J., He, J. and Zhang, T., 2021. Improvements in high-temporal resolution active fire detection and FRP retrieval over the Americas using GOES-16 ABI with the geostationary Fire Thermal Anomaly (FTA) algorithm. Science of Remote Sensing, 3, p.100016. doi:10.1016/j.srs.2021.100016
Wooster, M. J., Roberts, G., Freeborn, P. H., Xu, W., Govaerts, Y., Beeby, R., He, J., Lattanzio, A., Fisher, D., and Mullen, R. (2015). LSA SAF Meteosat FRP products – Part 1: Algorithms, product contents, and analysis. Atmospheric Chemistry and Physics, 15(22): 13217–13239. doi:10.5194/acp-15-13217-2015
Roberts, G., Wooster, M.J., Xu, W., Freeborn, P.H., Morcrette, J.-J., Jones, L., Benedetti, A., Jianping, H., Fisher, D., Kaiser, J.W. (2015). LSA SAF Meteosat FRP products - Part 2: Evaluation and demonstration for use in the Copernicus Atmosphere Monitoring Service (CAMS). Atmospheric Chemistry and Physics, 15(22): 13241–13267. doi:10.5194/acp-15-13241-2015
Can you provide a brief description of the two algorithms used to produce geostationary active fire products from GOES-16 and 18?
FRP-PIXEL Product
The key outputs from the FRP-PIXEL algorithm are active fire pixel detections and fire characteristics including fire radiative power (FRP), FRP uncertainty, active fire temperature, and fire detection confidence levels. The detection algorithm used in the FRP-PIXEL product is based on the principles applied to generate active fire detections within the MODIS Fire Products (Giglio et al., 2003). The algorithm works on statistics derived primarily from middle-infrared (MIR) and thermal infrared (TIR1) brightness temperature imagery. On a first pass, a series of absolute thresholds applied to these data are used to detect “potential” fire pixels. These pixels are then further assessed as true or false fire detections based on a series of further contextual tests based on statistics derived from immediate neighboring non-fire background pixels. Further description of the algorithm can be found in (Govaerts et al., 2010; Wooster et al., 2015).
The FRP-PIXEL product is available every 15 minutes for the SEVIRI full-disk and every 10 minutes for the AHI and ABI disks. The spatial resolution of the product at the sub-satellite point is 3-km for the SEVIRI data and 2-km for the AHI and ABI, but the pixel size systematically grows with increasing view zenith angle (VZA) from the sub-satellite point towards the edge of the disk (See above: What is the spatial resolution of the geostationary satellite observations?).
FDC-HSC Product
The key outputs from the FDC-HSC algorithm include information on the fire pixel locations, sub-pixel fire characteristics )active fire area and temperature), and FRP. The current FDC-HSC algorithm is a multispectral contextual algorithm designed to identify fire pixels through a decision-tree approach comparing them with their neighboring non-fire background pixels. The FDC-HSC algorithm uses a two-step approach. The first step is designed to identify all potential fire pixels while the second step further confirms and then characterizes the sub-pixel fire activity. The FDC-HSC product is available every 10 minutes. The spatial resolution of the product at the sub-satellite point is 2km, and the pixel size systematically grows with increasing VZA from the sub-satellite point towards the edge of the disk.The FDC-HSC product is available every 10 minutes. The spatial resolution of the product at the sub-satellite point is 2km, and the pixel size systematically grows with increasing VZA from the sub-satellite point towards the edge of the disk.
What are the Product Uncertainties and Limitations?
The FRP-PIXEL and FDC-HSC products are subject to several sources of uncertainties due to the characteristics of geostationary satellite full-disk data and associated image processing. Among these limitations:
- The spatial resolution of the data leads to missed smaller/less intense fires. Furthermore, the sensitivity to small/less intense fires decreases away from the sub-satellite point.
- The FRP-derived value is sensitive to the fire location within the pixel. This effect is due to the shape of the point spread function, i.e., its departure from an ideal rectangular box. A fire located at the center of the instrument’s instantaneous field-of-view will elevate the pixel temperature much more than a fire located far away from its center.
- Specific to the FRP, the non-linearity of the SEVIRI 3.9-μm channel above 310 K and the saturation of that band above 335 K can produce errors in the FRP estimate. Similarly, the saturation of the GOES-R ABI and AHI 3.9-μm channel above 400 K can produce errors in FRP.