
What is MODIS?
MODIS stands for Moderate Resolution Imaging Spectroradiometer. The MODIS instrument is aboard the Earth Observing System (EOS) Terra (EOS AM) and Aqua (EOS PM) satellites. The orbit of the Terra satellite goes from north to south across the equator in the morning and Aqua passes south to north over the equator in the afternoon resulting in global coverage every 1 to 2 days. The EOS satellites have a ±55 degree scanning pattern and orbit at 705 km with a 2,330 km swath width.The MODIS instrument provides 36 spectral bands from wavelengths of 0.4µm to 14.4µm. For more information, please visit the NASA MODIS website.
When were the Terra and Aqua satellites launched?
Terra (EOS AM) was launched 18 December 1999 and Aqua (EOS PM) was launched 4 May 2002. High quality hotspot/active fire observations are available from the Terra satellite starting November 2000 and from the Aqua satellite starting 4 July 2002 onwards.
What time does the satellite pass over my area?
Terra (EOS AM) passes over the equator at approximately 10:30 am and 10:30 pm each day, Aqua (EOS PM) satellite passes over the equator at approximately 1:30 pm and 1:30 am. The sun-synchronous orbit allows the satellites to pass over the same area at the same time in every 24 hour period (at every 99 minute orbit the satellites cross the equator at the above mentioned times; every other spot on Earth has similarly constant overpass times). The time of satellite pass will vary according to your location. To estimate when the satellite will pass over your area, you can use the satellite overpass predictor provided by NASA.
Daily Terra and Aqua global and regional orbit tracks are provided by the Space Science and Engineering Center (SSEC) at the University of Wisconsin-Madison. The maps show a series of white lines with tic marks showing what time the satellite will pass over a certain location on the Earth. The white lines represent the center of the swath and the tic marks and time show at what time in UTC the satellite has passed over that location.
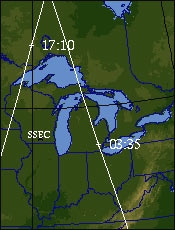
A cut-away from an orbit track map showing the Terra satellite overpass time near the Great Lakes (daytime granule starting at 17:10 UTC, nighttime granule starting at 03:35 UTC).
The maps have a series of white lines with tick marks on them that show what time (using Coordinated Universal Time, or UTC) the satellite will be passing over a particular location on Earth on a given day. The white lines represent the center of the swath. The time stamps mark the start of the northern (Terra) or southern (Aqua) edge of each 5-minute data collection period. An image acquired at that location will span roughly 1150 kilometers on either side of the tick mark. Every day there are two passes over most areas: one daylight pass, and one nighttime pass.
How often are data acquired?
The MODIS instrument aboard the Terra and Aqua EOS satellites acquire data continuously providing global coverage every 1-2 days. Therefore there are at least 4 daily MODIS observations for almost every area on the equator – with the number of overpasses increasing (due to overlapping orbits) the closer an area is to the poles. See What time does the satellite pass over my area?
What are MODIS Data "Collections"?
A MODIS data Collection is a MODIS data version. When new and improved science algorithms are developed, the entire MODIS dataset (from launch) is reprocessed and then tagged and distributed as a new "Collection". During the process of a Collection, an attempt is made to use the same version of the Science Algorithms or Program Executables (PGEs). However, sometimes a bug is found in one or more of the PGEs in the middle of Collection processing; and if the bug is not serious, processing will complete with the new corrected PGE. These anomalies and problems in processing are noted on the Known Problems page. One can always identify the Collection number for a particular HDF file as it's always included (as a 3 digit number) as part of the HDF filename. There have been six MODIS data Collections (or Versions) processed since MODIS/Terra was launched in early 2000. The Collection versions created thus far are 001, 003, 004, 005, 051, 006 and 06.1. MODIS Collection 6.1 (C6.1) was added in October 2017 to correct a number of issues in the Collection 6 (C6) Level-1B (L1B) data. The decision to create a new improved C6.1 was driven by the MODIS Atmosphere team to address a number of issues in the current C6 L1B data. These L1B issues had a negative impact in varying degrees in downstream MODIS Atmosphere Level-2 (L2) and Level-3 (L3) products. More information can be found at the MODIS Atmosphere website.
Starting in November 2017, C6 Land processing stream will use the C6.1 L1B as input, with no change to the land-science processing algorithms. We do not expect to see any significant impact to most land products from using upstream C6.1 as inputs except for some minor differences in Terra MODIS snow and sea-ice products because of differences in the Terra cloud mask. Therefore, C6 processing of NRT Terra- and Aqua-MODIS Land products will continue until sometime around the middle of 2018, when C6.1 processing of Land products will start.